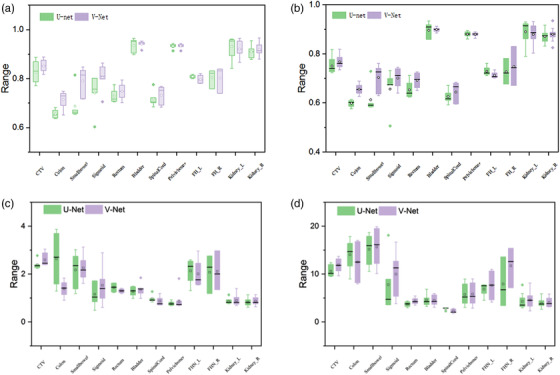
FIGURE 2.

The comparison of the four evaluation indicators of the two networks on delineation of different organs: (a) Dice similarity coefficient (DSC); (b) Jaccard index (JI); (c) average surface distance (ASD); (d) Hausdorff distance (HD). In the figure, the solid dots outside the box represent outliers in this set of data, the solid line inside the box represents the median of this set of data, and the open circles represent the average value of this set of data
