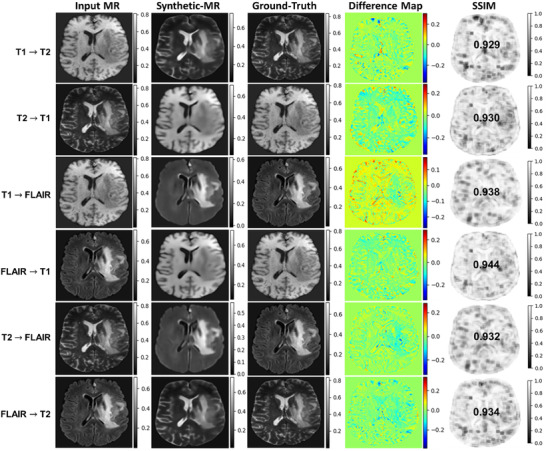
FIGURE 2.

The comparison of synthetic‐MR images generated using a U‐Net model for one subject on a test data set. From left to right: input MR images (source image contrast); synthetic‐MR images (target image contrast); ground‐truth/real MR image (target image contrast); difference map (predicted–real MR image); and SSIM map. Rows show image‐to‐image translations across T1, T2, and FLAIR MR contrasts
