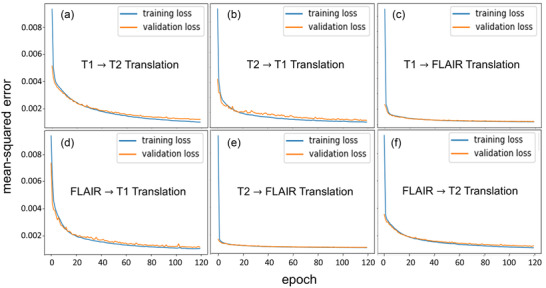
FIGURE 3.

A plot of the training loss versus validation loss over the number of epochs for all translations. (a) T1 to T2, (b) T2 to T1, (c) T1 to FLAIR, (d) FLAIR to T1, (e) T2 to FLAIR, and (f) FLAIR to T2. The training learning curve shows the goodness of the model's learning, whereas the validation learning curve shows the goodness of the model's generalization
