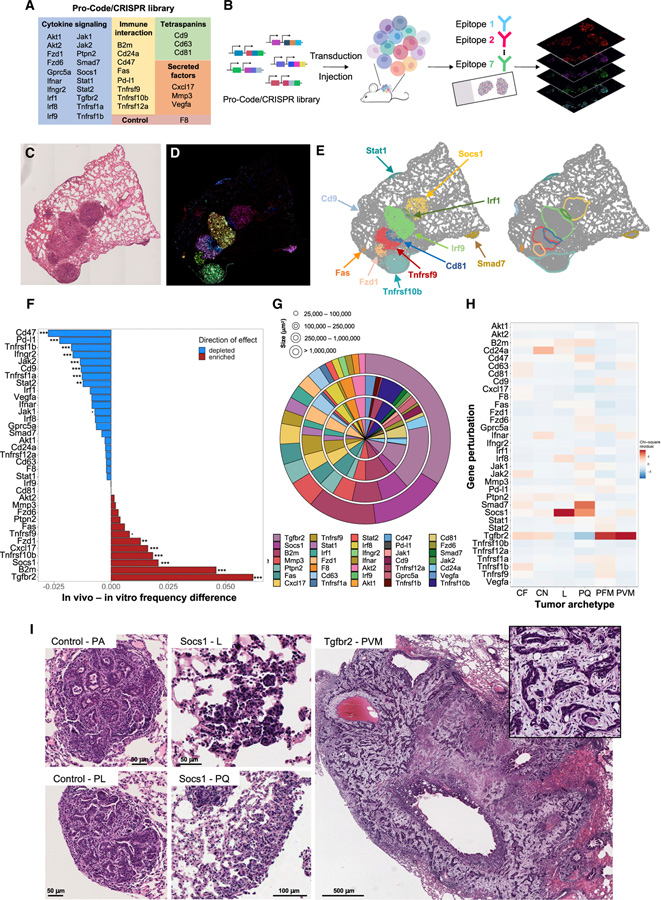
Figure 3. Perturb-map identifies genes regulating tumor development and architecture in vivo.
(A) Table of the genes targeted in the Pro-Code/CRISPR library.
(B) Perturb-map experimental pipeline. For the studies in Figures 3 and 4, KP-Cas9 were transduced with the nPC/CRISPR library in (A) and injected into 11 mice from 2 independent experiments (n = 5 and 6). Lungs were collected after 4 weeks, and Formalin-fixed, paraffin-embedded (FFPE) tissue sections were prepared and stained for 7 tags to detect 35 nPC populations and for specific cell markers (see Figure 4). Sections imaged by whole slide scanning.
(C–E) Overview of the Perturb-map analysis pipeline. (C) Representative H&E section of 1 lung lobe from a mouse. (D) Overlay of pseudocolored nPC tag staining for the same tissue section as in (C). Different colored areas correspond to different nPC populations. (E) Debarcoded and reconstituted digital image of the tissue section in (D). (Left panel) Each dot represents a cell, colored based on nPC expression (nPC negative cells in gray). Gene perturbation can be annotated directly on the image based on nPC expression. (Right panel) Tumor boundaries were defined following DBSCAN clustering of nPC+ cells.
(F) Relative frequency of nPC/CRISPR KP tumors. The frequency of each nPC/CRISPR KP-Cas9 population was determined pre-injection (by CyTOF) and compared with the relative abundance of corresponding nPC/CRISPR lesions in vivo. Significant differences in tumor engraftment were determined using a one-sample two-tailed Poisson exact test comparing to F8 engraftment as the null hypothesis. Poisson rate parameters were determined by the ratio of formed tumor lesions in vivo to the number of cells in vitro pre-injection for each KO (. = p < 0.1; * = p < 0.05; ** = p < 0.01; *** = p < 0.001).
(G) Quantification of tumor lesions’ size across gene perturbations. Shown are percentages of tumors associated with each gene perturbation within discrete tumor size categories. Each ring corresponds to a tumor size range as indicated. Perturbations are organized in clockwise order from Tgfbr2, following the order represented in the figure legend.
(H) Histopathology analysis of nPC/CRISPR tumor lesions. Total of ~1,750 tumors was scored on H&E sections (with no Pro-Code staining) and tumor histopathological archetype identified. The heatmap shows the standardized residuals of a chi-squared test between gene perturbation and tumor archetype (chi-squared p value 4.43 × 10⁻¹⁴).
(I) Representative example of tumor archetypes associated with Socs1 and Tgfbr2 gene KO. PA, parenchymal; PL, pleural; L, lepidic; PQ, pleural plaque; PVM, perivascular mucinous tumor.

