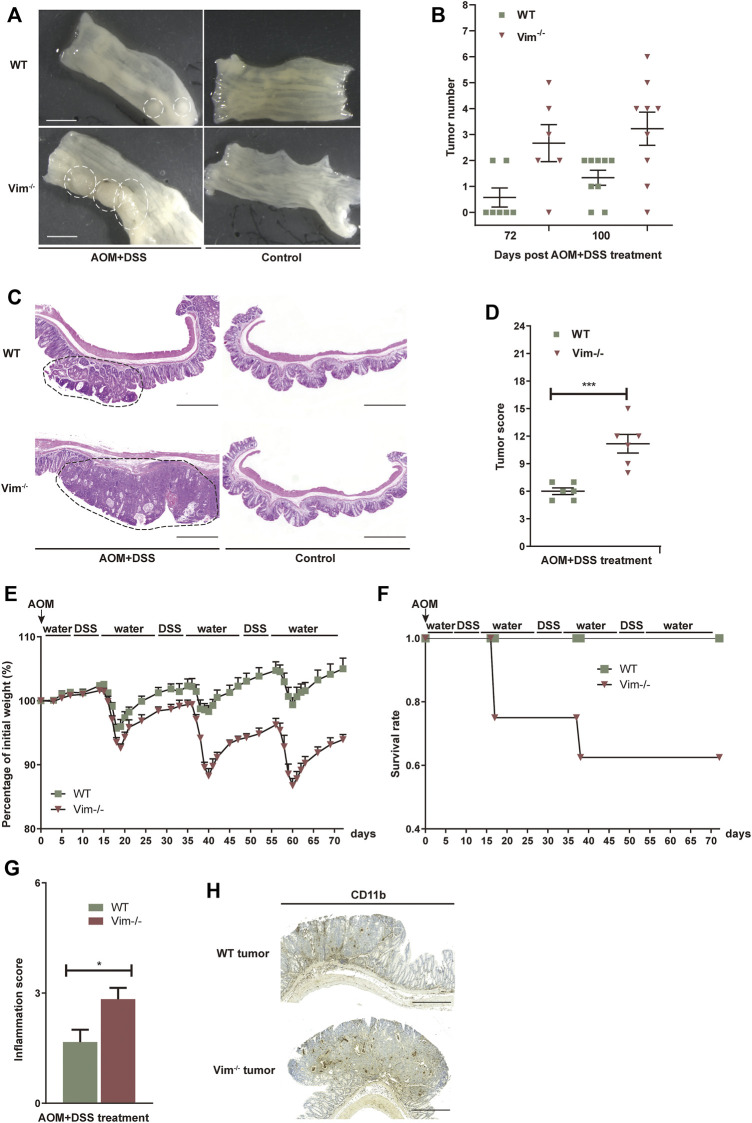
FIGURE 3.
Increased tumorigenesis in vimentin null mice in a colitis-associated colon cancer model. (A) Representative macroscopic view of WT and Vim−/− mouse colon on day 75 upon AOM + DSS induction. Scale bar, 1 mm. (B) Colitis-associated colorectal was induced via injection of AOM (7.5 mg/kg) and three cycles included 2% DSS feeding for 7 days and water for 14 days. The tumor numbers per mouse colon between WT and Vim−/− mice on day 75 and day 100 were recorded cumulatively from three independent experiments. Each dot represents one mouse. Lines indicate mean ± SEM. n = 24 (C) Representative pictures of Hematoxylin and Eosin staining of WT and Vim−/− mouse colon on day 100 upon AOM + DSS induction or untreated ones (Control). Scale bar, 500 μm. (D) Tumor score between WT and Vim−/− colons. n =6. (E,F) Vim−/− and WT mice during AOM + DSS treatment in colitis-associated colon cancer model were monitored for body weight loss and the survival during the 72 days of treatment. (G) These mice from colitis-associated colon cancer model were sacrificed at day 72 and histological scores of colon tumor sections were determined on the basis of the colitis index. (H) Representative images and quantitation of CD11b-labeling of the colon tumor samples.

