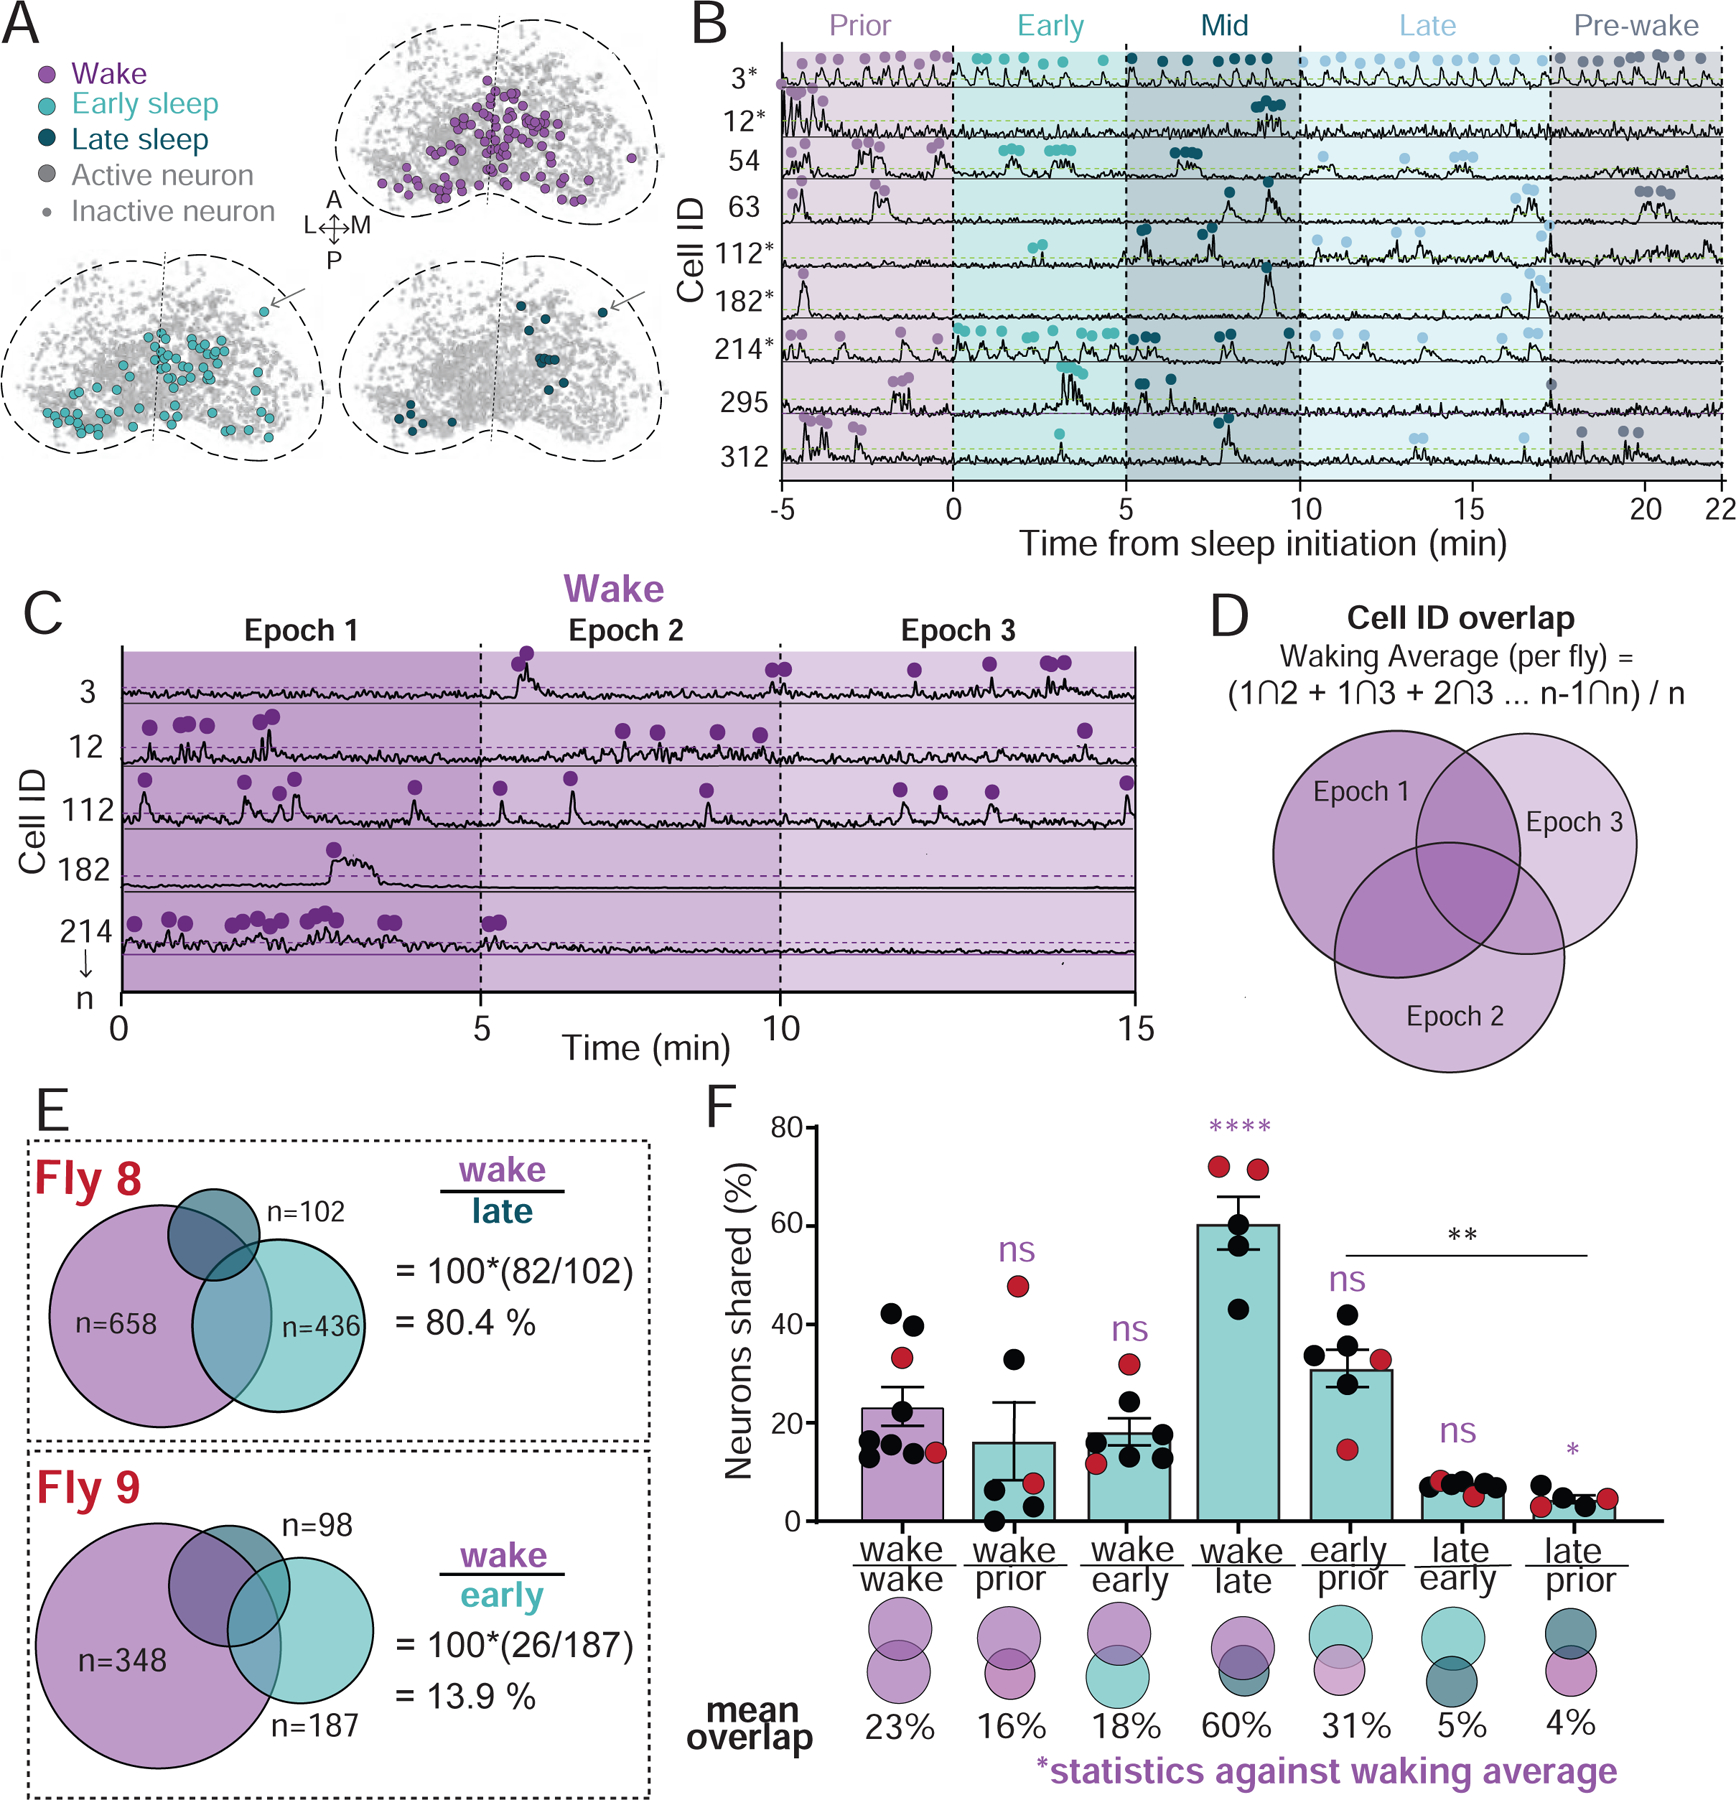
Figure 2: Neural identity overlaps during wake and spontaneous sleep stages.

A) Collapsed masks of neurons active during wake, early sleep, and late sleep in neurons from Figure 1E. Active neurons met activity criteria in other epochs. Inactive neurons are ROIs that were identified through segmentation, but never met activity criteria. Arrow: an active neuron tracked across epochs. B) Example neural activity traces for neurons during a sleep bout. Dotted green line: activity threshold (colored dots; see Figure S2A,B). *, same neuron as in C. C) Example neural activity across three successive 5 min epochs of wakefulness. Dotted purple line: activity threshold (colored dots). D) Calculation of the average overlap in neural activity during wake (waking average). Neurons indicated are the same as in B and C. E) Overlaps in neural identities during wake and sleep stages in two example flies. The number of active neurons in each is indicated. % overlap = 100*((#stage 1 ∩ #stage 2) / #stage2). F) Overlap in neural identities compared to the waking average (% overlap ± sem). Flies from E are indicated with red dots. One-way ANOVAs with Dunnett’s multiple comparison correction. ns = not significant, * = p < 0.05, ** = p < 0.01, **** = p < 0.0001. Waking average, n = 9; all other data, n = 7. See also Figure S2.
