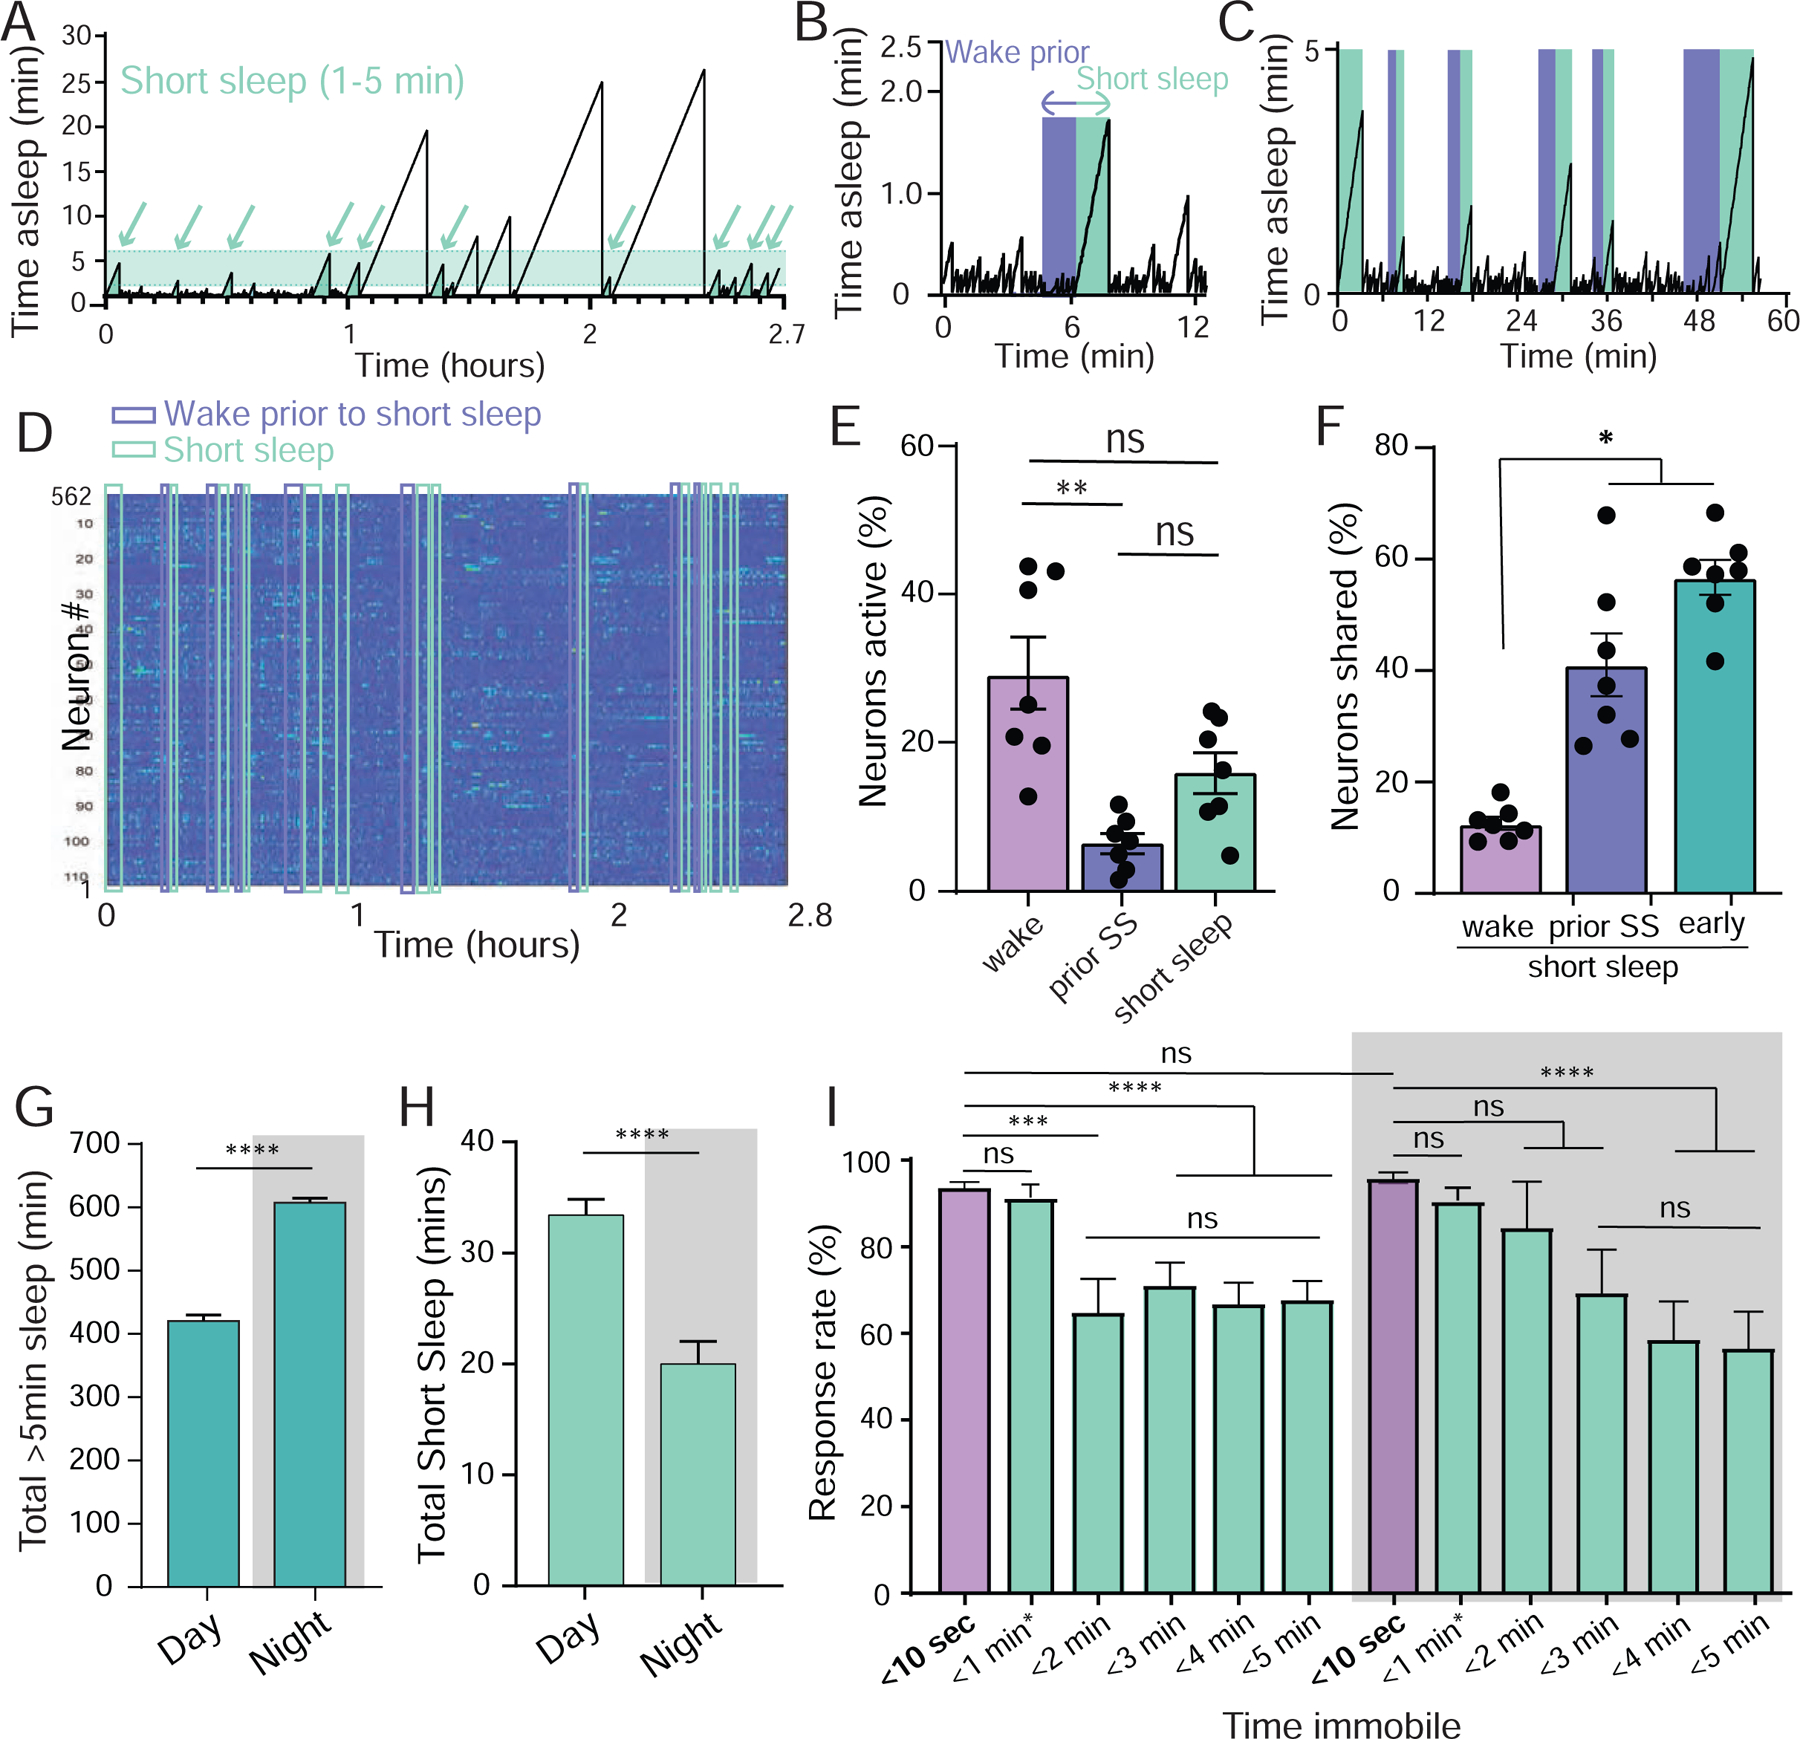
Figure 3: Short sleep bouts.

A) Short sleep (shaded, 1–5min) epochs (arrows, from same fly as in Figure 1I). B,C) For every 1–5min epoch identified (green), an immediately preceding ‘prior wake’ epoch of equal length (1–5min) was identified and used for further comparisons (purple). D) Neural activity across all active ROIs for the duration of the experiment in A, with all short sleep and corresponding prior wake epochs indicated. E) Neural activity (% neurons active ± sem) in short sleep (green) compared to wake prior to sleep (purple) and the waking average (lavender). F) Significantly more active neurons are shared between short sleep and early sleep, and between short sleep and prior sleep, than between short sleep and wake. E, Wilcoxon matched-pairs signed rank test, * = p < 0.05; F, one-way ANOVA with Bonferroni multiple comparison correction. ns = not significant, * = p < 0.05, ** = p < 0.01. n=7 flies. G) Average total sleep (± sem) for day and night in freely-walking flies, based on >5min immobility criterion. H) Average total 1–5min sleep (± sem) for day and night in the same flies as in G. I. Average behavioral responsiveness (% ± sem) to a vibration stimulus during day and night as a function of prior immobility duration, for different durations (green) compared to briefly quiescent flies (<10 sec, lavender). Flies are the same as in G and H. <1min* epoch includes <10 sec. For G and H, test = Wilcoxon signed-rank test; for I, test is One-way ANOVA with Dunnett’s multiple comparison correction. ns = not significant, *** = p < 0.001, **** = p < 0.0001.
