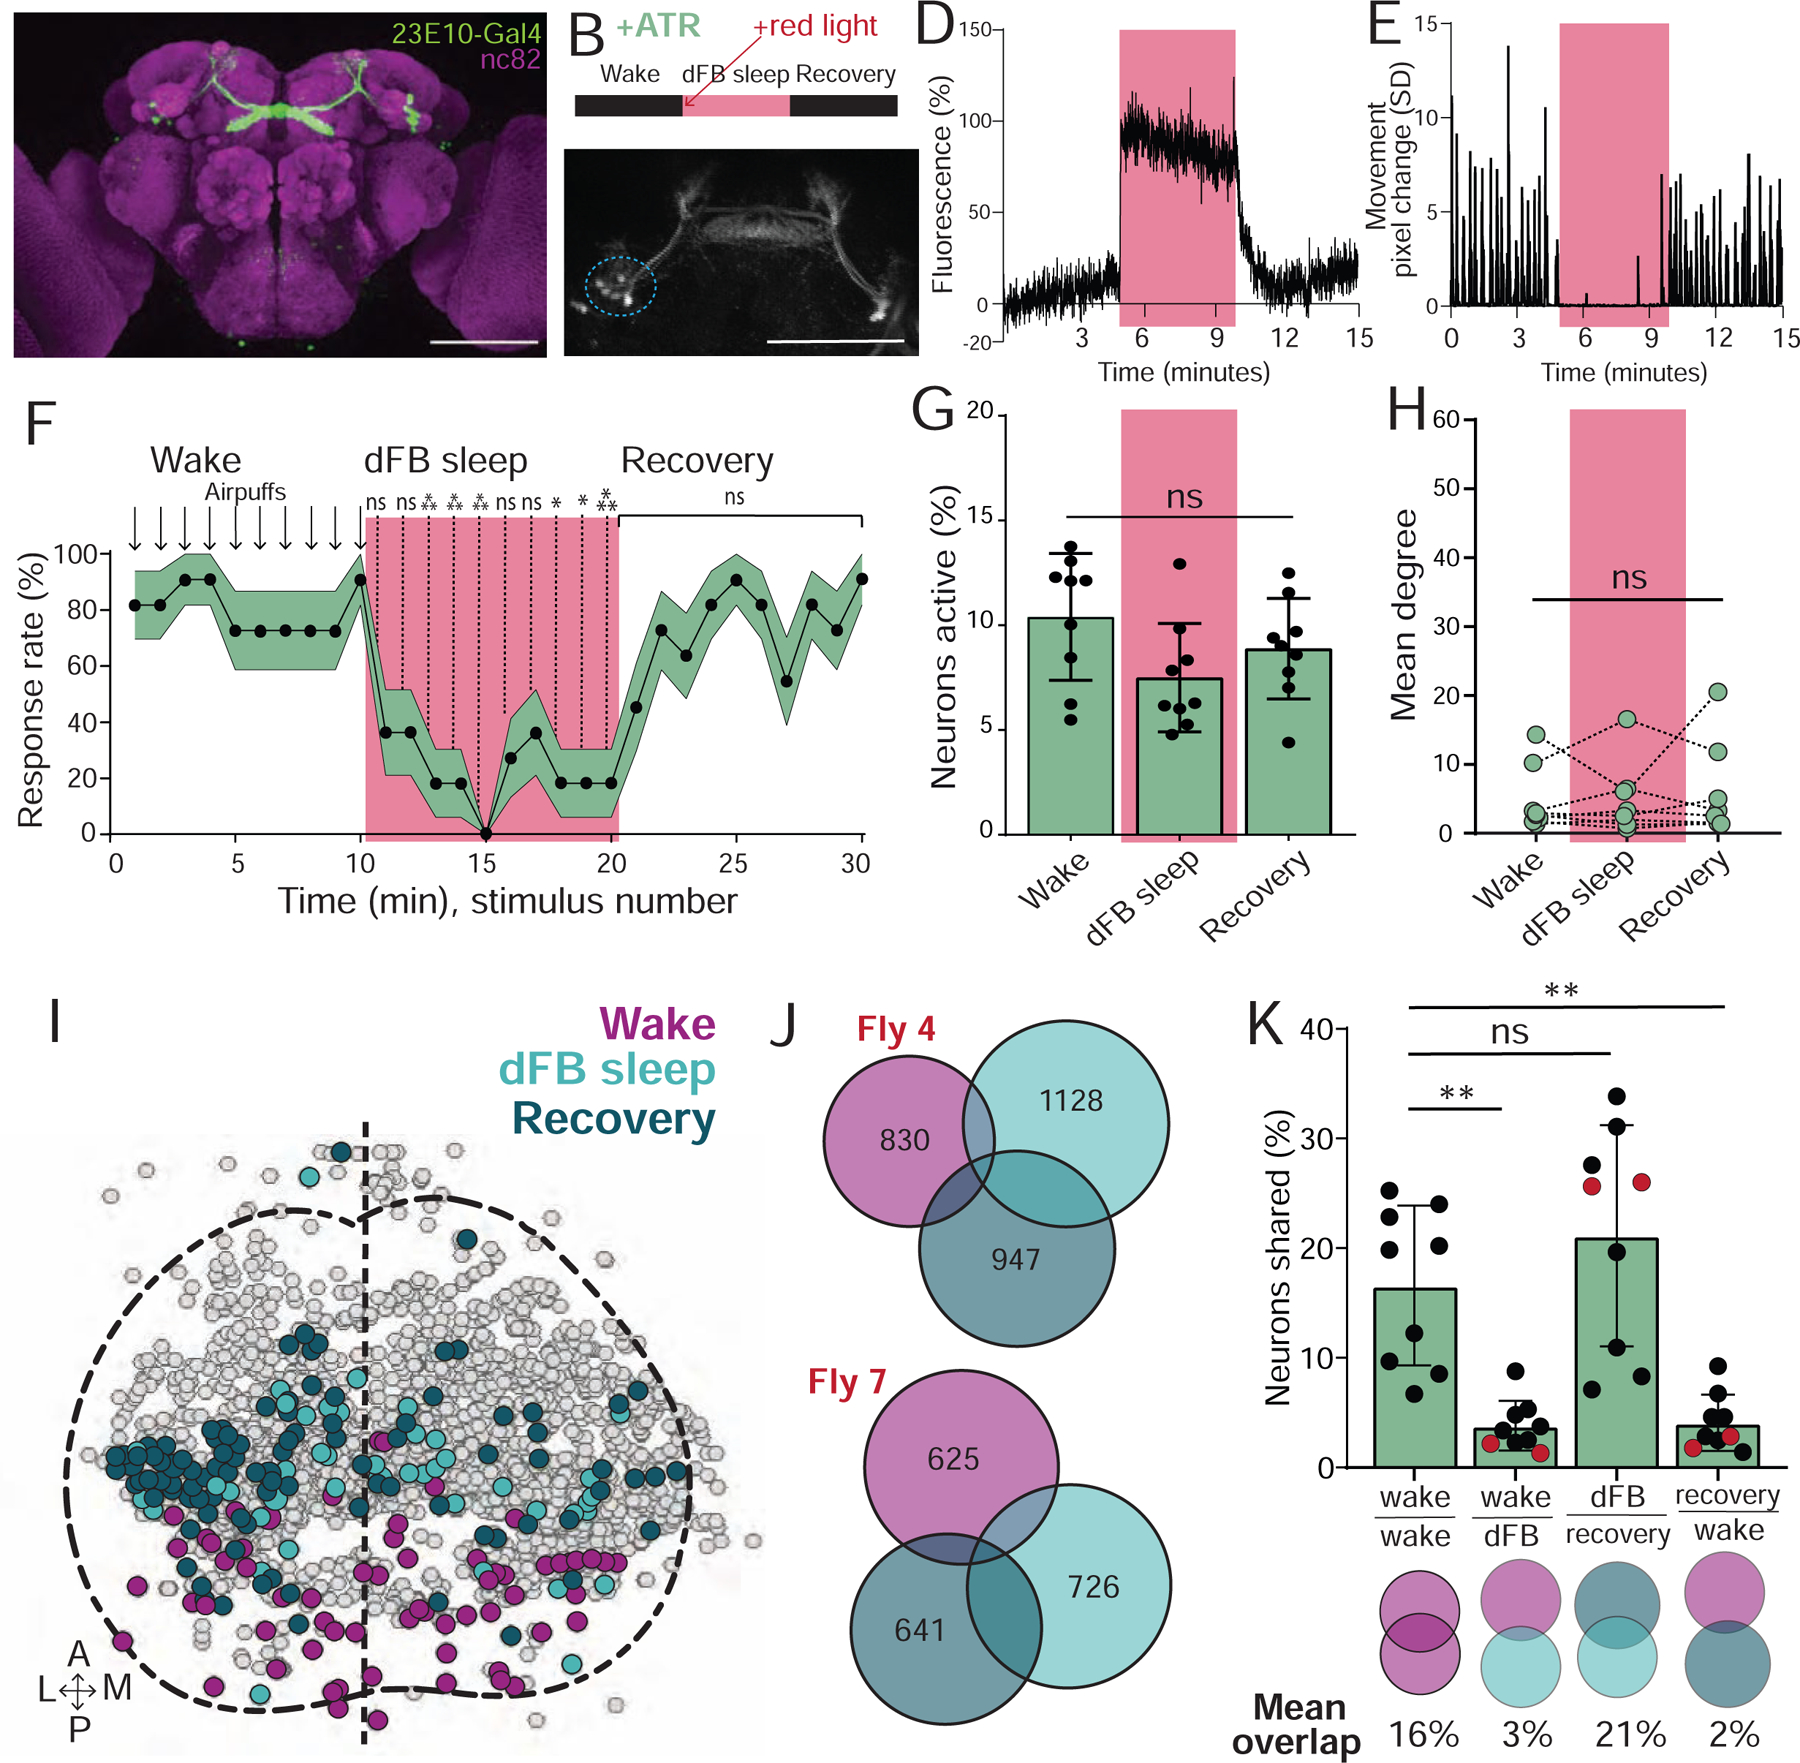
Figure 4: dFB-induced sleep resembles wakefulness.

A) R23E10:Gal4-UAS:GFP expression (green). Scalebar=100μm. B) Experimental sequence. C) R23E10:Gal4-UAS:CsChrimson; UAS:GCaMP6f imaging during optogenetic activation. Scalebar=100μm. D) Optogenetic activation (red) led to an increase in GCaMP6f fluorescence in dorsal fan-shaped body (dFB) soma (circled blue in C). E) Corresponding movement trace from fly in D. F) Behavioral responsiveness (% ± sem) of flies to air puffs, before, during (red), and after optogenetic activation of the dFB. G) % neurons active (± SD) in UAS:Chrimson / X ; Nsyb:LexA/+ ; LexOp:nlsGCaMP6f / R23E10:Gal4 flies did not change during optogenetic activation of the dFB (red) in ATR-fed flies, compared to baseline wake and recovery. H) Mean degree did not change during optogenetic activation of the dFB (red), compared to baseline wake and recovery. I) Example collapsed mask of neurons active during waking, dFB sleep, and recovery. J) Overlaps between these three neural groups in two example flies. Numbers indicate active neurons within each condition. K) Analysis of the overlapping neurons between conditions. Red dots indicate flies shown in J. F: 2-way ANOVA with Dunnett’s multiple comparison test. *=p<0.05, **=p<0.01, ***=p<0.001; n=11 flies. G, H, and K: one-way ANOVA with Kruskal-Wallis multiple comparison test, ns = non-significant; n = 9 flies. See also Figure S3 and Video S2.
