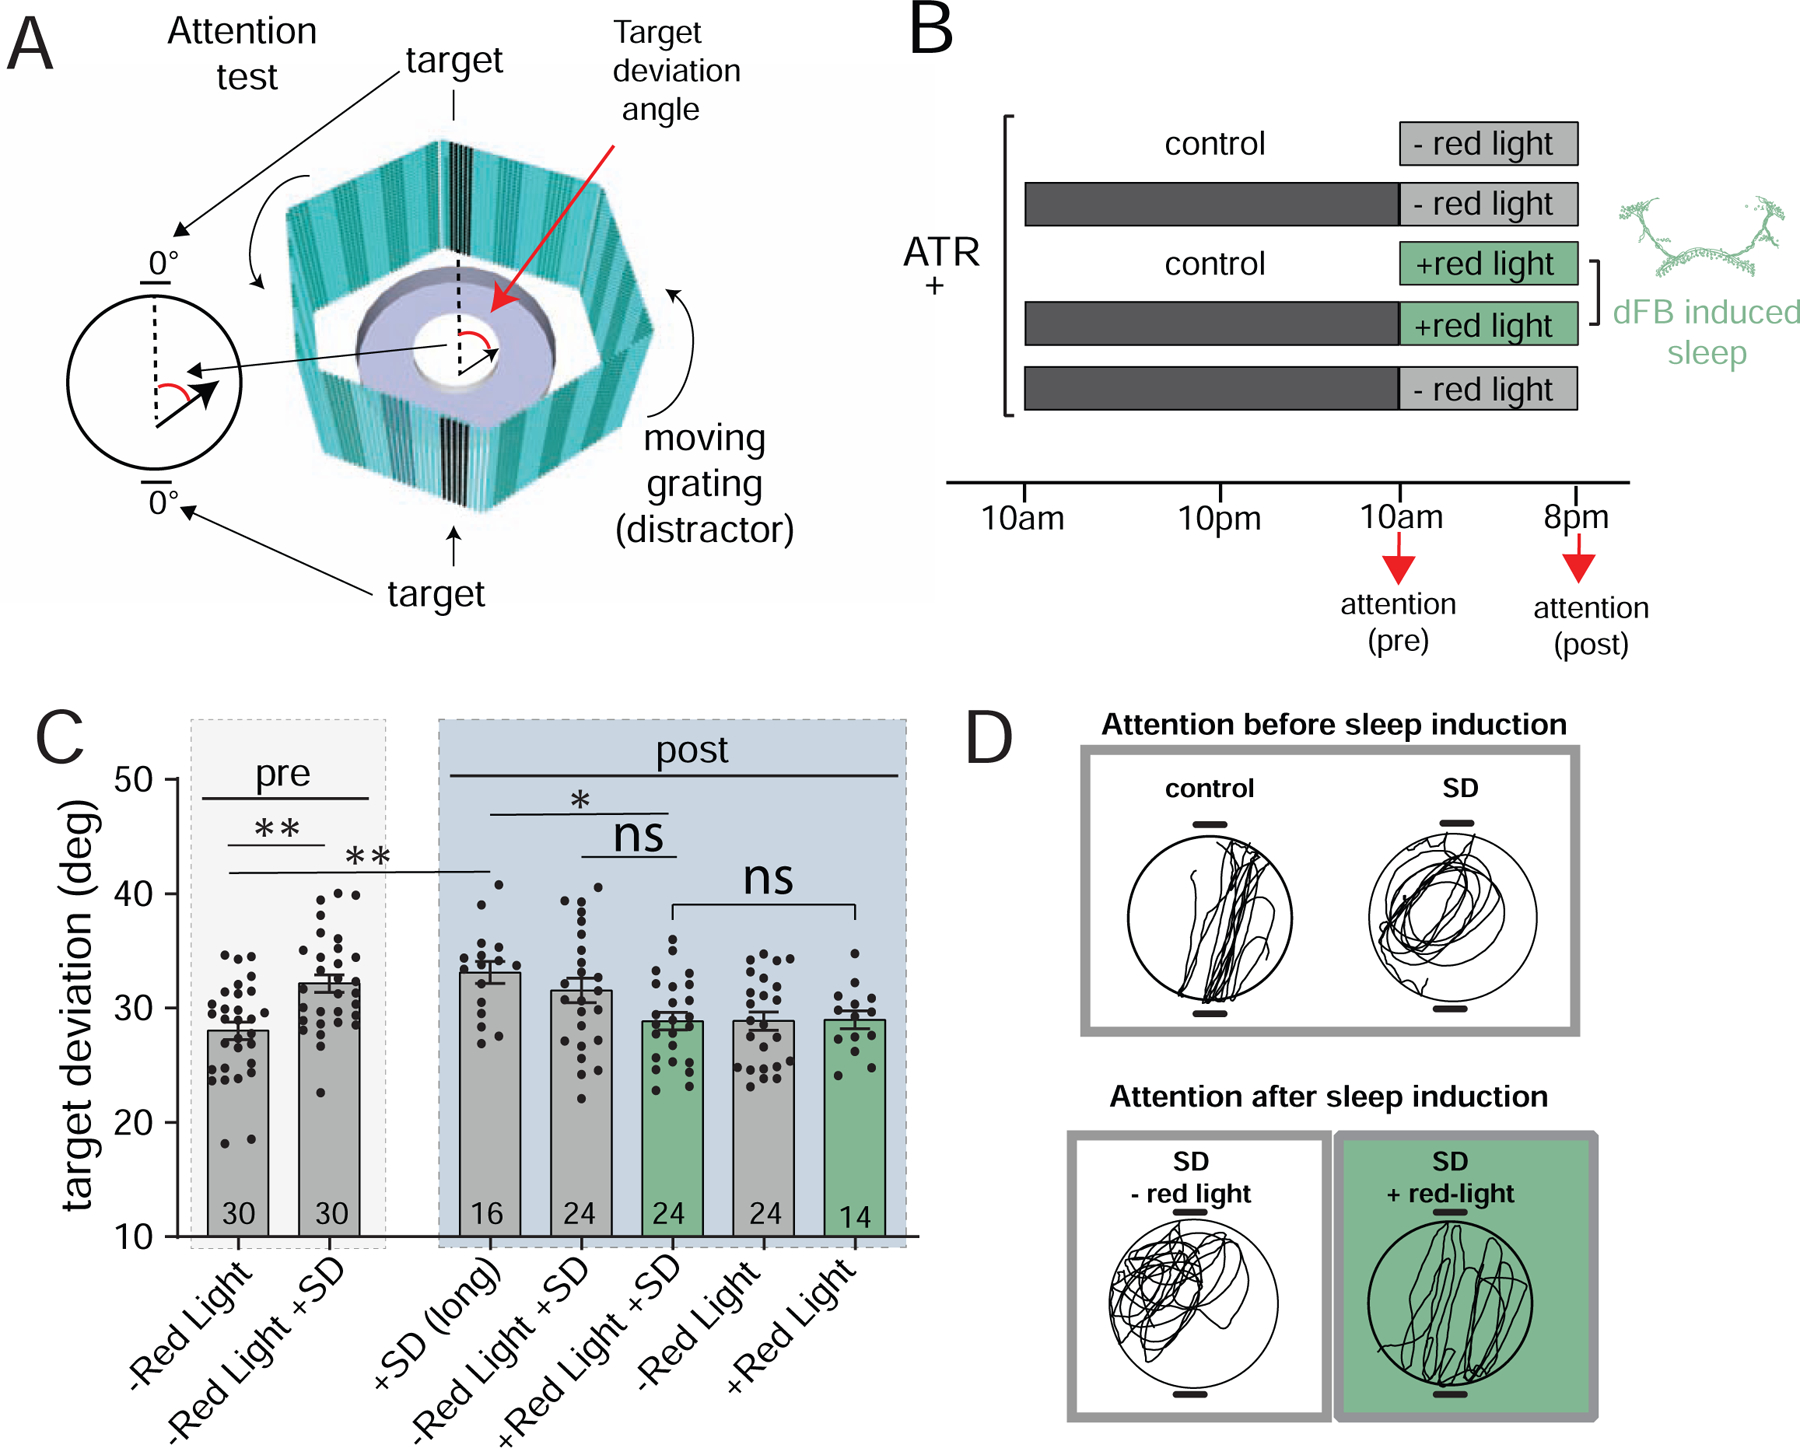
Figure 5. dFB-induced sleep corrects visual attention deficits following sleep deprivation.

A) Diagram of the visual attention paradigm. Flies walking central platform are presented with two opposing flickering dark bars (targets) and a moving cyan grating in the background (distractor). Inset: attention is measured by the angle between the fly’s trajectory (black arrow) and the closest target (target deviation). B) Protocol for behavioral testing (all experiments with w+; R23E10-Gal4/+>UAS-CsChrimson/+ flies). Attention (pre & post) indicate when flies were tested for visual attention. C) Target deviation (degrees ± sem) before (pre) and after (post) dFB-induced sleep, for all of the conditions outlined in B. Fly numbers are indicated, pooled across 2–3 experiments each. D) Example traces of walking paths of flies immediately following sleep deprivation (SD) compared to non sleep-deprived controls (top), and after subsequent sleep induction (SD +red light) compared to controls (SD – red light). Statistical tests for C is one-way ANOVA with Dunnett’s multiple comparison correction. * = p<0.05, ** = p<0.01, *** = p<0.001. See also Figure S4.
