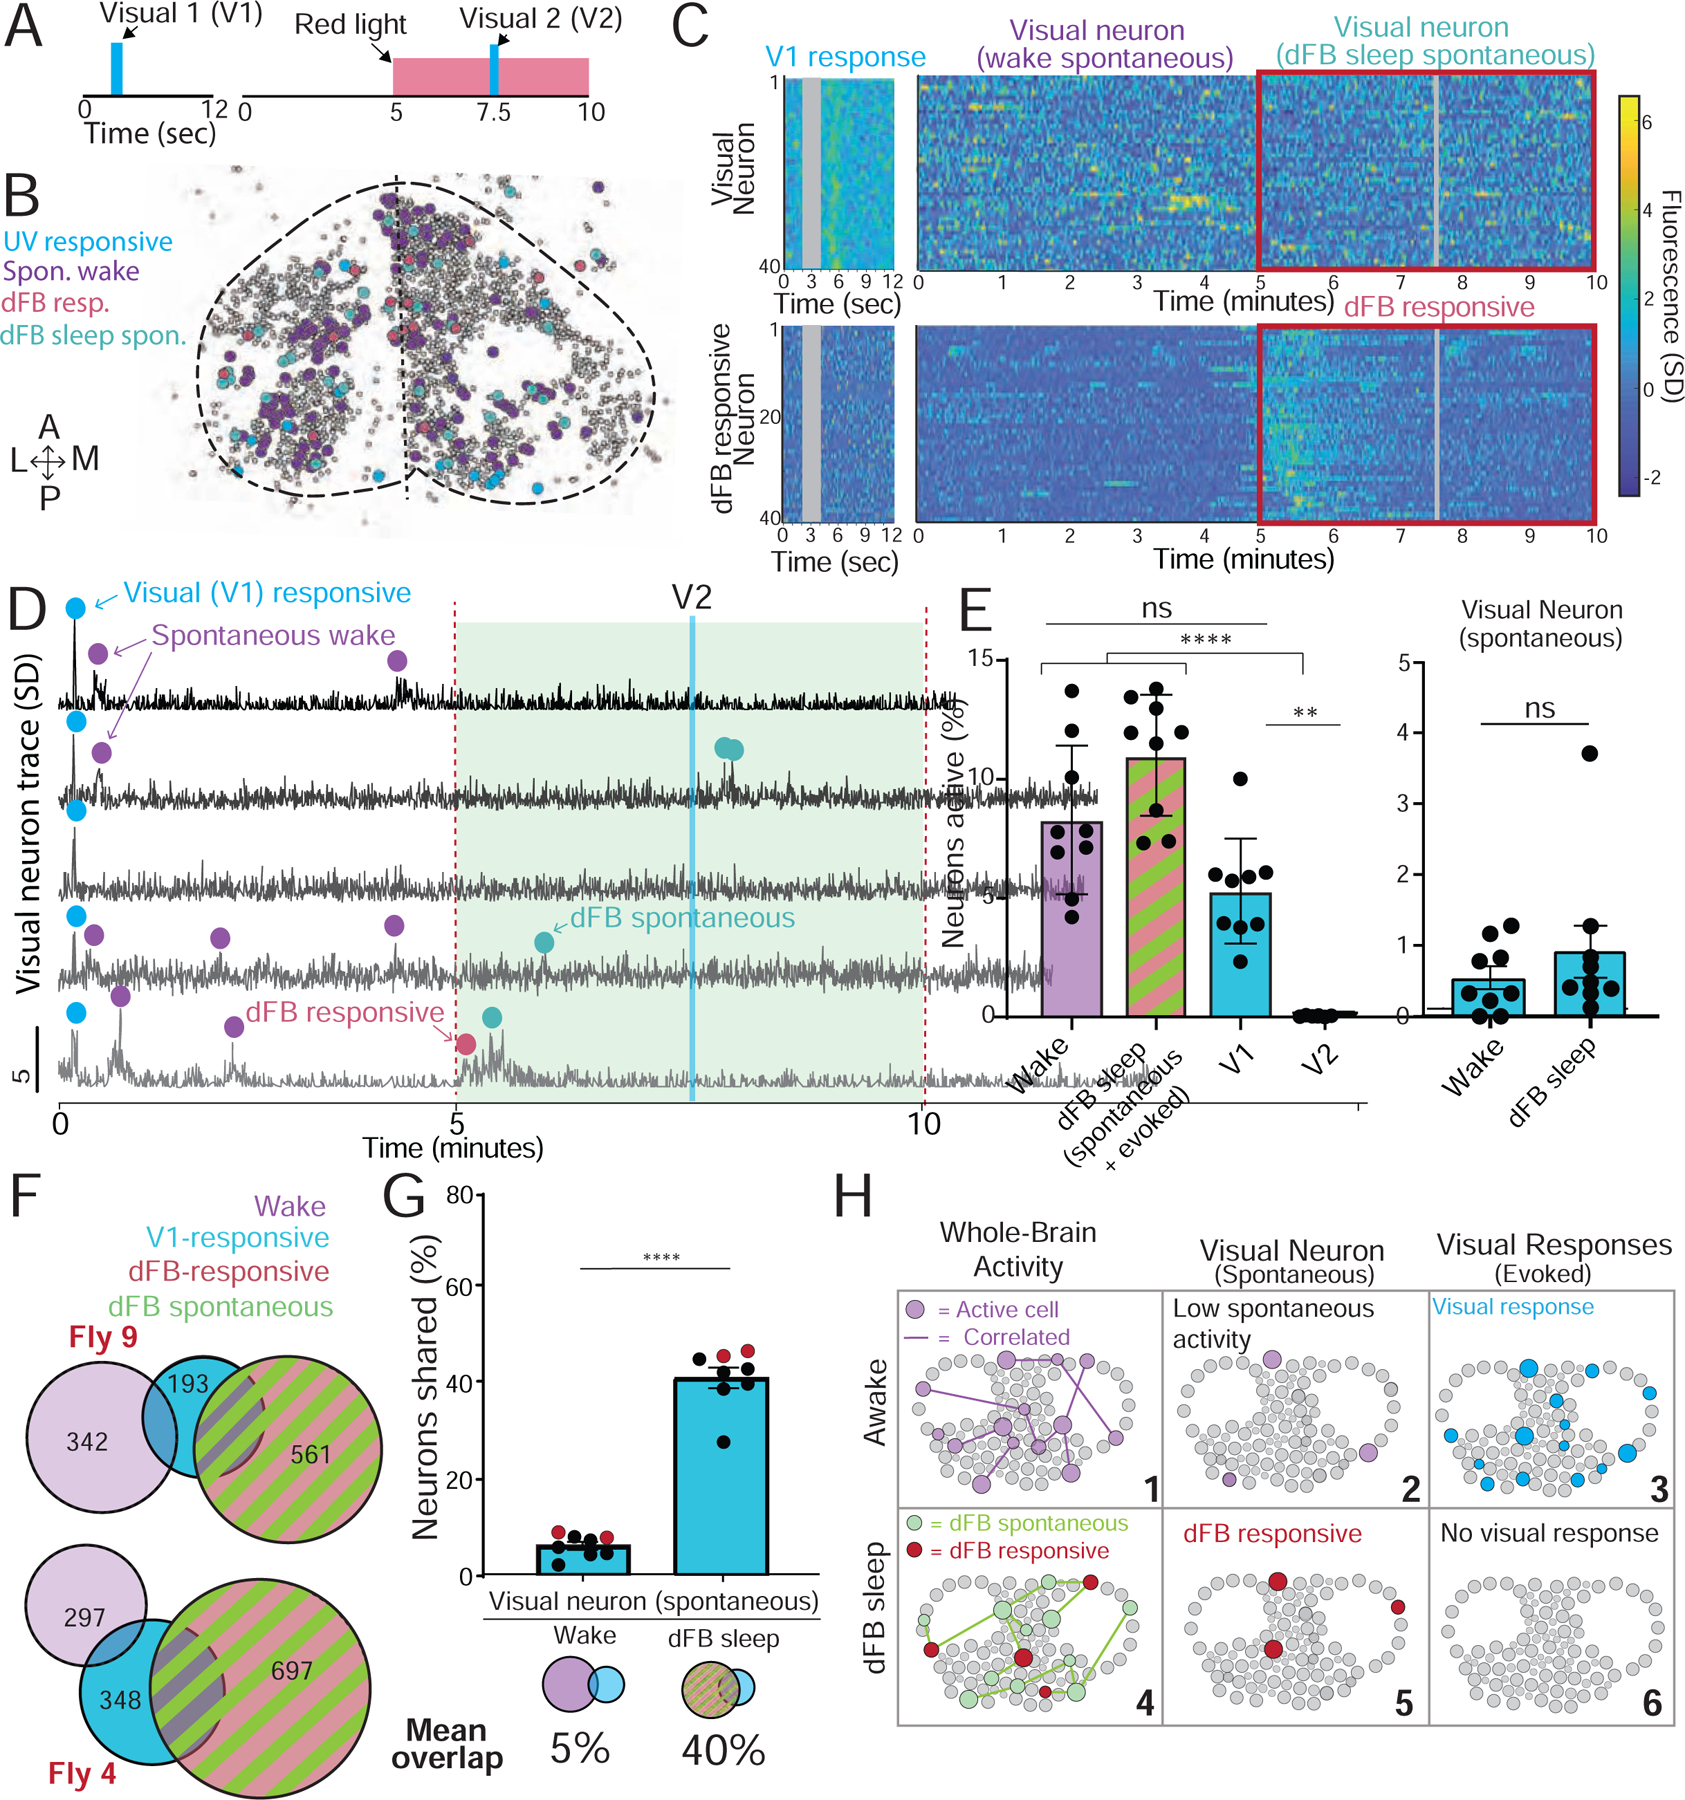
Figure 6. Visual responses in the brain are lost during dFB sleep.

A) A 2-second ultraviolet (UV) stimulus (V1) was used to probe visual responses in the brain of w+ ; UAS:CsChrimson / X ; Nsyb:LexA/+ ; LexOp:nlsGCaMP6f / R23E10:Gal4 flies during wakefulness and during dFB sleep (V2). B) A collapsed mask of spontaneous baseline neurons (purple), dFB-responsive neurons (red), spontaneous dFB sleep neurons (green), and visually responsive neurons (blue) in an example fly. C) Top left: visually responsive neurons in an example fly. Top right: spontaneous activity in the same neurons during wake and dFB sleep (red box). Bottom left: data from the same fly for dFB responsive neurons presented with the visual stimulus. Bottom right: the same dFB responsive neurons during wake and dFB sleep (red box). Gray bar: timing of visual stimulus. D) Calcium activity traces of five neurons found to be responsive to the first visual stimulus during wake (V1, blue dot); purple, spontaneous waking activity; green, spontaneous activity during dFB activation; red, response directly driven by activation of the dFB. E) Left: % active neurons during wake (purple), dFB sleep (green/red) and following visual stimulation (cyan). Right: spontaneous activity of visual neurons during both wake and dFB sleep. F) Overlapping active neurons between V1 (blue), wake (purple) and dFB sleep (red/green) in two example flies. The number of active neurons per group is indicated. G) V1 neurons had a significantly higher overlap across dFB sleep-active neurons compared to spontaneous wake neurons. Red dots indicate the flies shown in F. H) Cartoon of dFB sleep effects on spontaneous and evoked activity. (6). Tests = one-way ANOVA with Friedman multiple comparison test. ns = non-significant, * = p<0.05, ** =p<0.01, **** =p<0.0001. n = 9 flies. Error bars in E are SD, error bars in G are sem. See also Figure S5 and S6.
