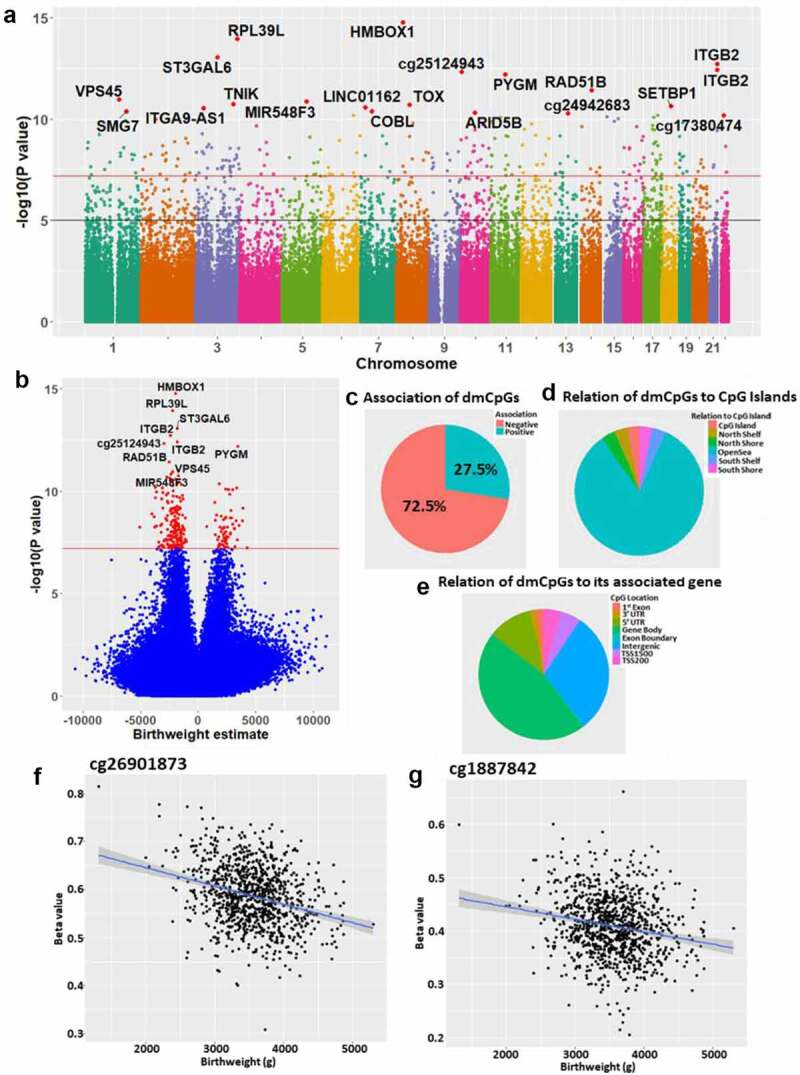
Figure 1.

(a) Manhattan plot of the differential methylation results with respect to birthweight, highlighting the genome-wide changes in DNA methylation with respect to birthweight. The black line represents p = 1 x 10⁻⁵, while the red line represents Bonferroni p = 6.45 x 10⁻⁸. (b) Volcano plot of the methylation results, with CpGs passing the Bonferroni threshold highlighted in red. The black line represents p = 1 x 10⁻⁵, while the green line represents Bonferroni p = 6.45 x 10⁻⁸. (c) Proportion of the Bonferroni dmCpGs showing a negative(red)/positive(blue) association with birthweight. (d) Genomic location of the Bonferroni dmCpGs relative to CpG islands (mainly in open sea – blue). (e) For the dmCpGs associated with a gene, the location of the dmCpG relative to that gene. (F + G) Scatterplots of birthweight (g) and methylation % for the top two birthweight-associated dmCpGs.
