
Figure 3.
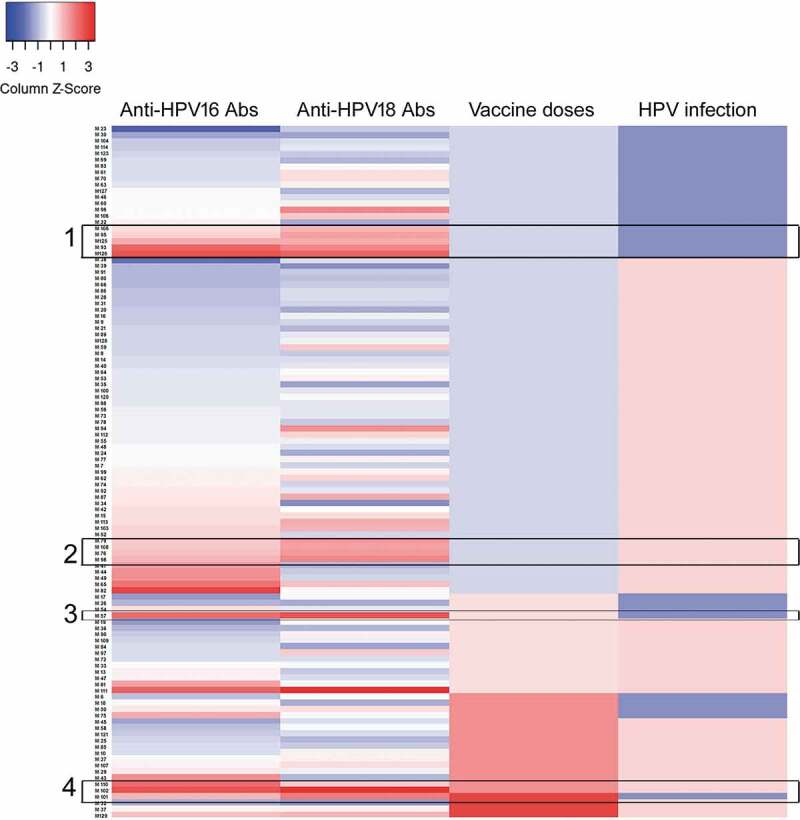
Heatmap analysis of seroprevalence, infection, and vaccination. Analysis of the levels of specific antibodies against HPV16 and 18, and their association with the presence of HPV infection and vaccination status were analyzed by heatmap. For the antibody levels the scoring star with blue color for negative or low levels and change to red color for higher amounts of antibodies detected by ELISA. For the vaccination status, the blue color represents unvaccinated girls and the increasing intensity in red represents 1, 2, or 3 doses of the HPV vaccine. Finally, for HPV infection blue color represent HPV- girls and light red color represent girls with HPV infection (any HPV). Each horizontal line represents one girl, and the sample number is indicated in the left side of the graph. Rectangles 1 and 2 show unvaccinated double seropositive girls, while rectangles 3 and 4 show vaccinated double seropositive girls.