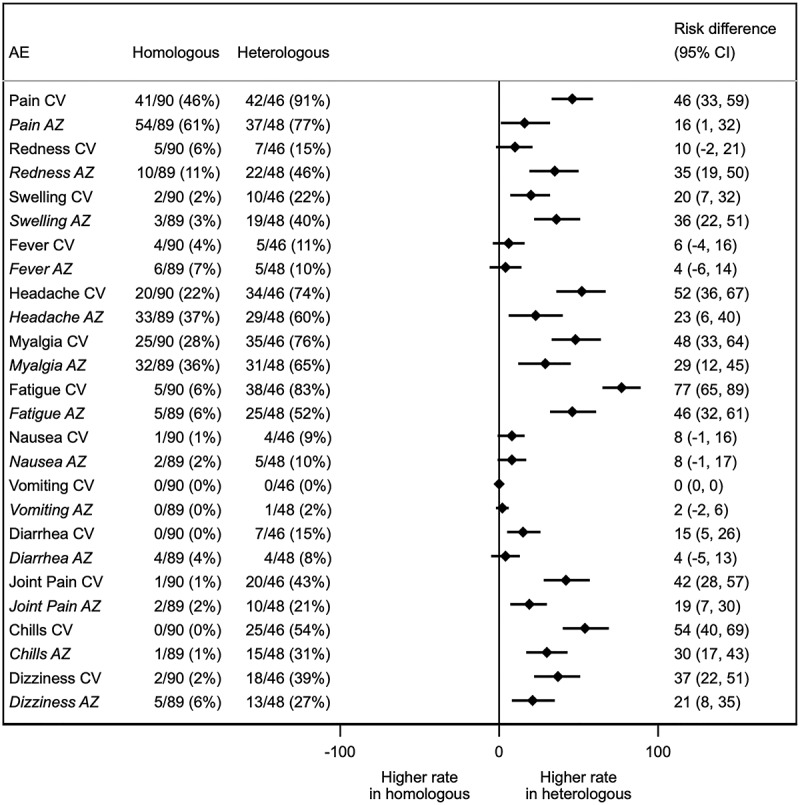
Figure 1.

Forest plot showing the percentages of solicited local and systemic adverse events (AEs) and the absolute differences in the proportion of participants with any grade solicited AEs across 7 days after second dose vaccination with 95% confidence intervals. CV and AZ in the first column refer to the prime vaccination. AE denotes an adverse event.
