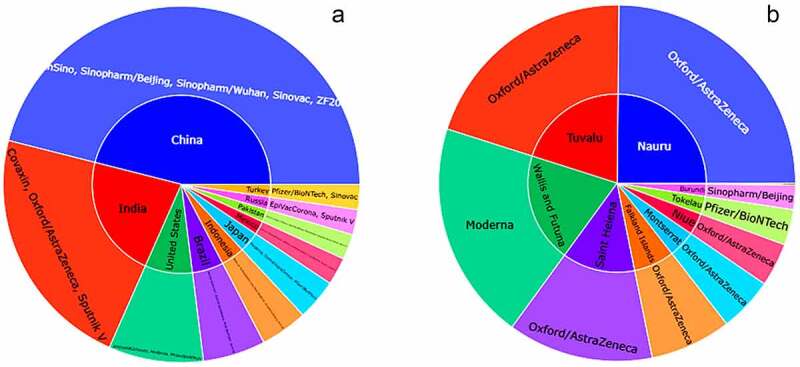
Figure 4.

Sunburst plot representation of most and least vaccinated used countries and their used vaccine. 4(A) shows the highest number of vaccines utilized countries along with the group of vaccine and 4(B) visualize the least vaccine used countries with their vaccine group utilizations.
