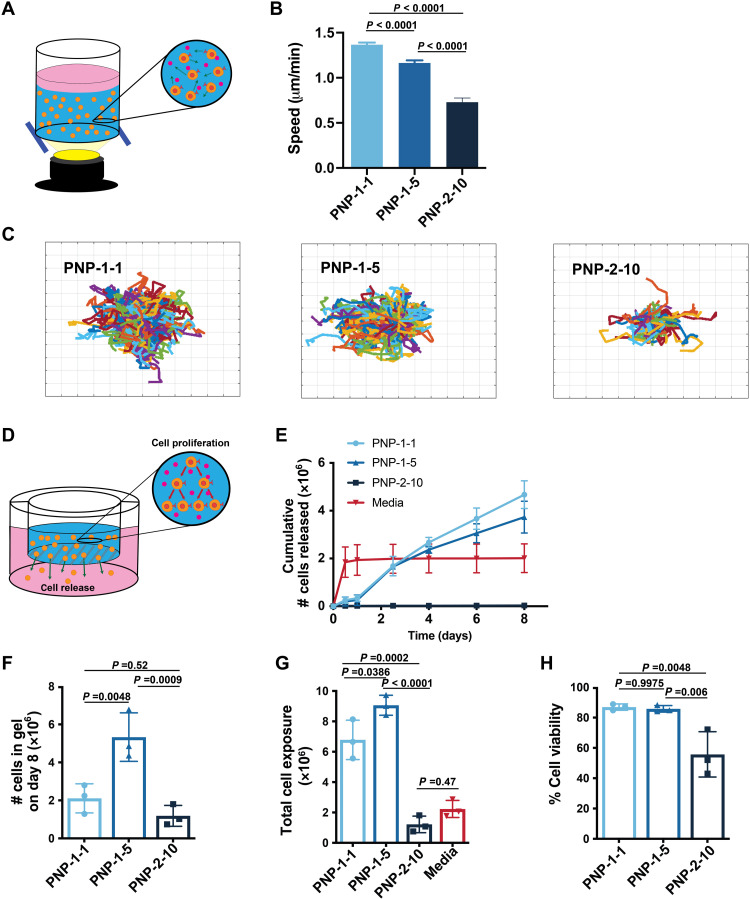
Fig. 4. PNP hydrogels control T cell motility and release.
(A) Schematic illustration of in vitro experimental setup to evaluate CAR-T cell motility within PNP hydrogels. (B) CAR-T cell migration speeds in different PNP hydrogel formulations as quantified through cell migration experiments (n > 150 cells for all samples; means ± SEM). (C) Trajectories of migrating CAR-T cells within indicated formulations over 30 min. PNP-1-1, PNP-1-5, and PNP-2-10 hydrogel formulations were tested, where the first number is the wt% HPMC-C12 polymer and the second number is the wt% NPs. The trajectories are plotted at a common origin for easy visualization, where each grid is 50 μm wide. (D) Schematic of experimental setup to assess cell release from PNP hydrogel formulations. Hydrogel is injected into a porous transwell suspending over medium. Cells both proliferate in the hydrogel and escape into the medium below. (E) Cumulative number of cells released into the medium below over time of various PNP hydrogel formulations and a liquid medium control. At each time point, the medium below the transwell was replaced. (F) The total number of cells still remaining in the PNP hydrogel formulations at the end of the assay after 8 days, indicating whether proliferation within the hydrogel in addition to release has occurred. (G) The total cell exposure as quantified by the sum of the cumulative released cells and total cells in the transwell. (H) Cell viability of the cells remaining in the PNP hydrogel formulations in the transwell at the end of the cell release assay.

