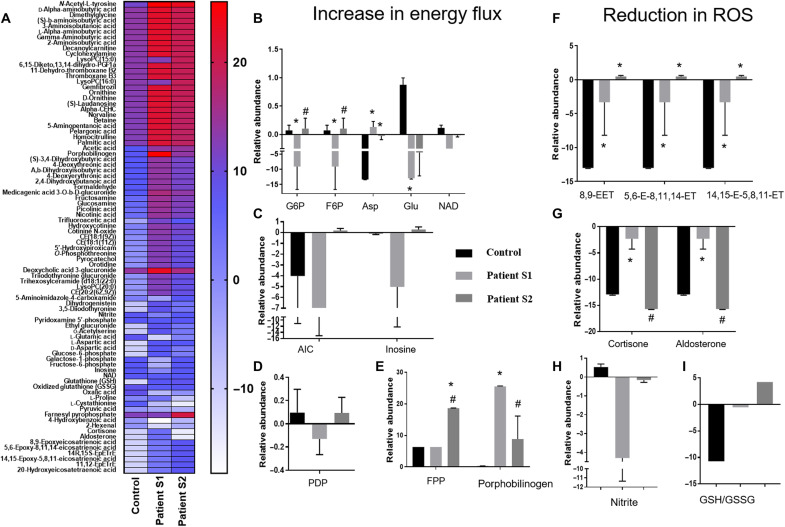
Fig. 8. Metabolomic analysis of patient PBMCs before and after the treatment.
Patient PBMCs were analyzed for the presence of metabolites and their relative abundance using mass spectrometry before (patient sample, S1) and after (patient sample, S2) the drug treatment. These profiles were compared to the metabolomic profile of a healthy individual (control). The metabolites were broadly screened for their association in modulating cellular energy flux and ROS levels. (A) The figure shows the heatmap of significantly altered metabolites in patient PBMCs. (B) Histograms showing metabolites involved in energy metabolism such as glucose-6-phosphate (G6P), fructose-6-phosphate (F6P), aspartate (Asp), glutamate (Glu), and nicotinamide adenine dinucleotide (NAD). (C) Relative abundance of 5-aminoimidazole-4-carboxamide (AIC) and inosine metabolites in control, S1, and S2 groups. (D) Histograms showing comparative relative abundance of pyridoxamine 5-phosphate (PDP). (E) Relative abundance of farnesyl pyrophosphate (FPP) and porphobilinogen. (F) Relative abundance of EET intermediates involved in ROS reduction related to arachidonic acid metabolism. (G) Relative abundance of cortisone and aldosterone. (H) Relative abundance of nitrite. (I) Relative abundance of reduced (GSH) to oxidized (GSSG) glutathione GSH/GSSG ratio. The “n” is representative of technical replicates and was analyzed by two-way ANOVA. Data are represented as means ± SD; *P < 0.05 in comparison to control and #P < 0.05 in comparison to patient sample, S1.

