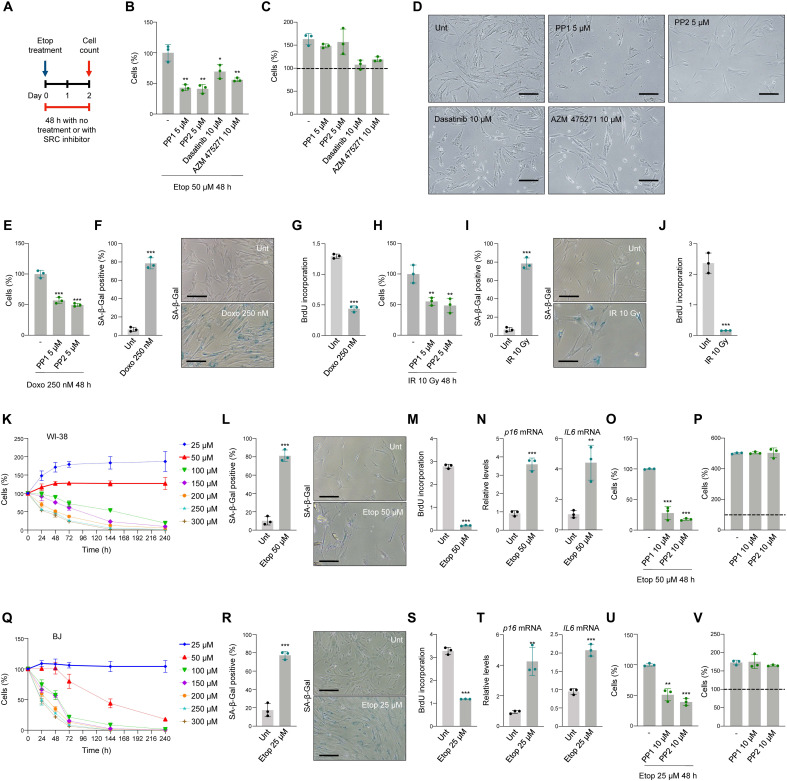
Fig. 2. Inhibition of the SRC activity orients cells toward apoptosis instead of senescence.
(A) Schedule of SRC inhibitor and etoposide treatments. (B and C) IMR-90 cell viability was measured by direct cell counting 48 hours after treatment with SRC inhibitors and 50 μM etoposide (B) or no etoposide (C). Dashed line, cells present at t = 0 (C). (D) Representative IMR-90 cell micrographs 48 hours after treatment with 50 μM etoposide and SRC inhibitors. Scale bars, 100 μm. (E to G) Cell viability, measured as in (B), 48 hours after treating IMR-90 cells with doxorubicin (Doxo) (250 nM) and SRC inhibitors (E); senescence was assessed by SA-β-Gal staining (F) and BrdU incorporation (G) assays. (H to J) IMR-90 cell viability 48 hours after treatment with IR (10 Gy) and SRC inhibitors (H). Senescence was assessed by SA-β-Gal staining (I) and BrdU incorporation (J) assays. (K to N) Percent live human WI-38 fibroblasts (direct counts) after treatment with different etoposide concentrations (K); senescence at day 10 was assessed by SA-β-Gal staining (L), BrdU incorporation (M), and RT-qPCR analysis of the levels of p16 and IL6 mRNAs, normalized to ACTB mRNA levels (N). (O and P) Viability (direct counts) of WI-38 fibroblasts treated with 50 μM etoposide (O) or untreated (P) and treated with SRC inhibitors; dashed line, cell numbers at t = 0. (Q to T) Percent live human BJ fibroblasts (direct counts) after treatment with different etoposide concentrations (Q); senescence at day 10 was assessed by SA-β-Gal staining (R), BrdU incorporation (S), and RT-qPCR analysis of the levels of p16 and IL6 mRNAs, normalized to ACTB mRNA levels (T). (U and V) Viability (direct counts) of BJ fibroblasts treated with 50 μM etoposide (U) or untreated (V) and treated with SRC inhibitors; dashed line, cell numbers at t = 0. In (B), (C), and (E) to (V), significance was assessed by two-tailed Student’s t test. Graphs represent means ± SD (n = 3 experiments); significance (*P < 0.05, **P < 0.01, ***P < 0.001) was determined using two-tailed Student’s t test.

