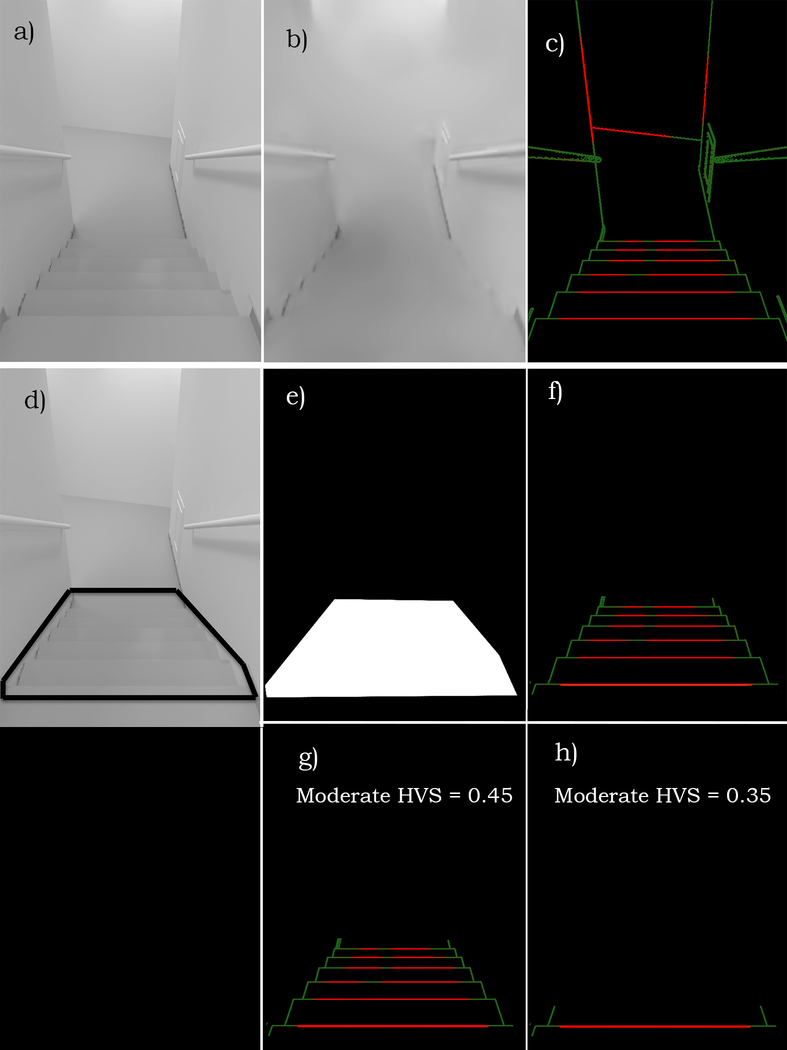
Figure 4.
Analysing low-vision visibility from a design model
(a) An HDR computer graphics image of a stairway in the Lighthouse building, modelled with REVIT and rendered with RADIANCE. (b) The original image, filtered to simulate the visibility under moderate low vision. (c) The results of an automated visibility analysis, with red lines indicate geometric structure predicted to not be visible and the green lines indicate geometry predicted to be perceivable. (d) The designer can indicate the boundaries of a portion of the image of particular concern (a region-of-interest (ROI)), which limits where the analysis is performed. (e) Confirmation of the image pixels making up the ROI. (f) Finally, a visualized analysis of the location of mobility hazards, which might be missed if only reviewing the specified conditions of acuity and contrast sensitivity shown in figure b. We show below how to compute a numerical Hazard Visibility Score (HVS) that significantly aids in using this process to choose the optimal design option for the staircase and first step edge (g and h).

