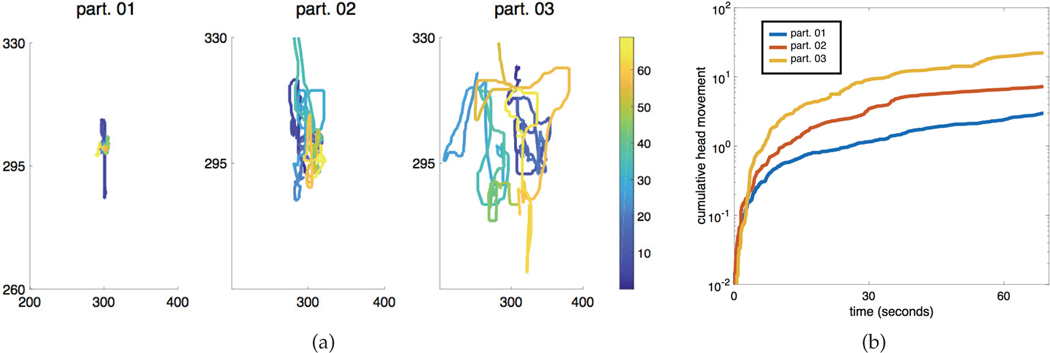
Fig. 6:
Examples of the head movement of three participants during the Puppets stimuli. 6a shows the head movements of the participants, where the axis represent pixel coordinates in the video recording. The lines are color-coded with respect to time, where the colorbar on the right represents time (seconds) in the movie stimuli. A log-plot of the cumulative head movement (as a simple quantifying measure) for all three participants is shown in 6b. Figure is best viewed in color.

