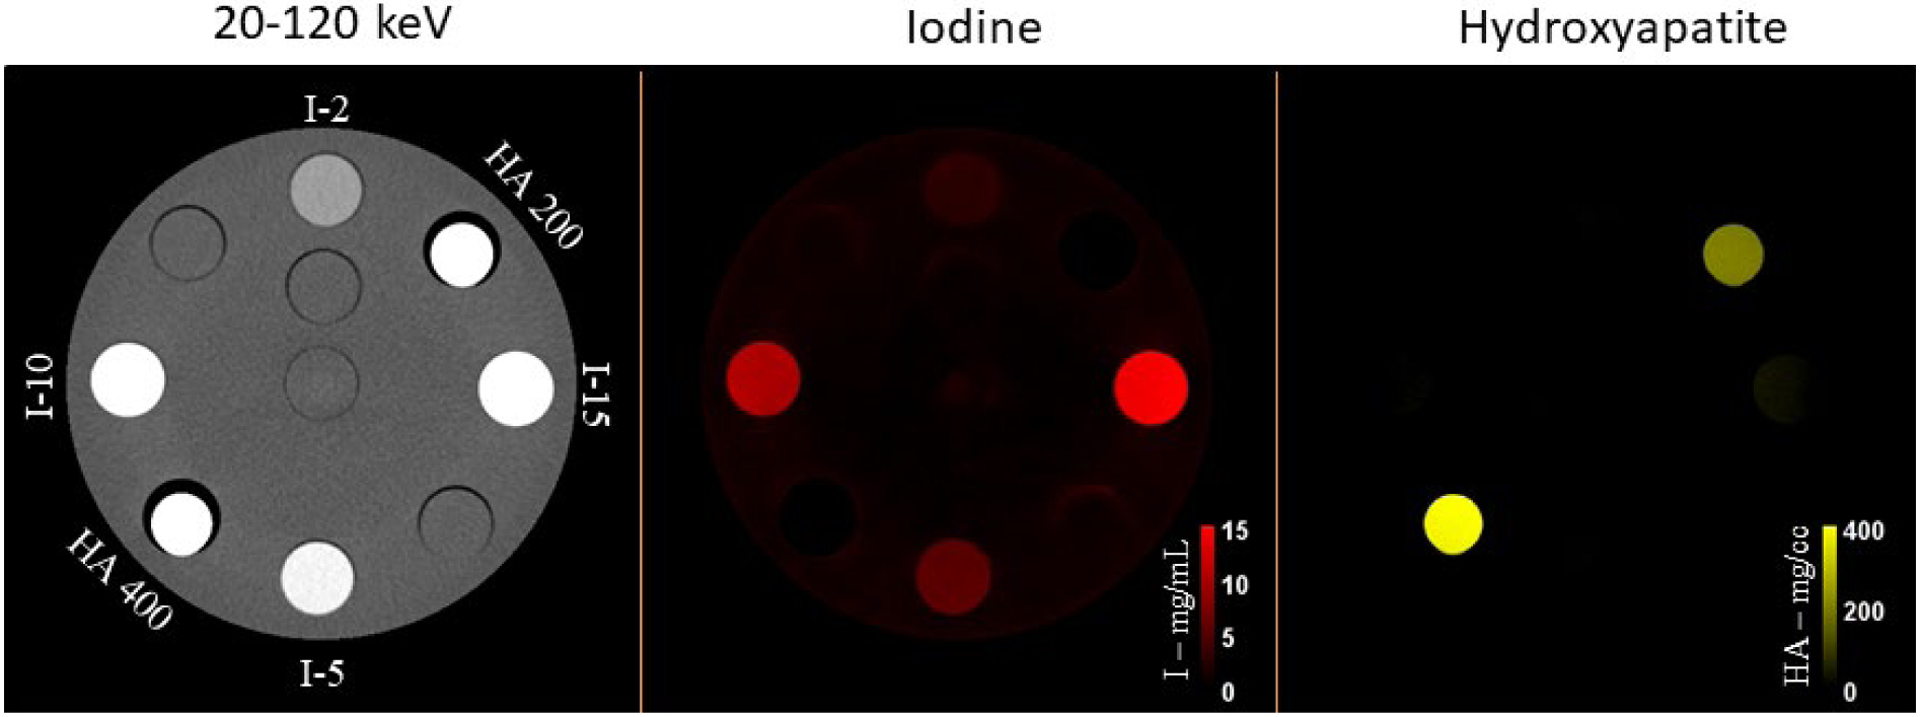
Figure 3.

PCD-CT threshold low image (20–120 keV) of the multi-energy CT phantom showing various concentrations of iodine (2, 5, 10 and 15 mg/mL) and HA (200 and 400 mg/cc). After material decomposition, iodine and HA inserts are well delineated in the iodine and bone maps, respectively, with accurate quantification of concentrations with reference to ground truth (RMSE = 0.38 mg/mL and 6.15 mg/cc for iodine and HA, respectively).
