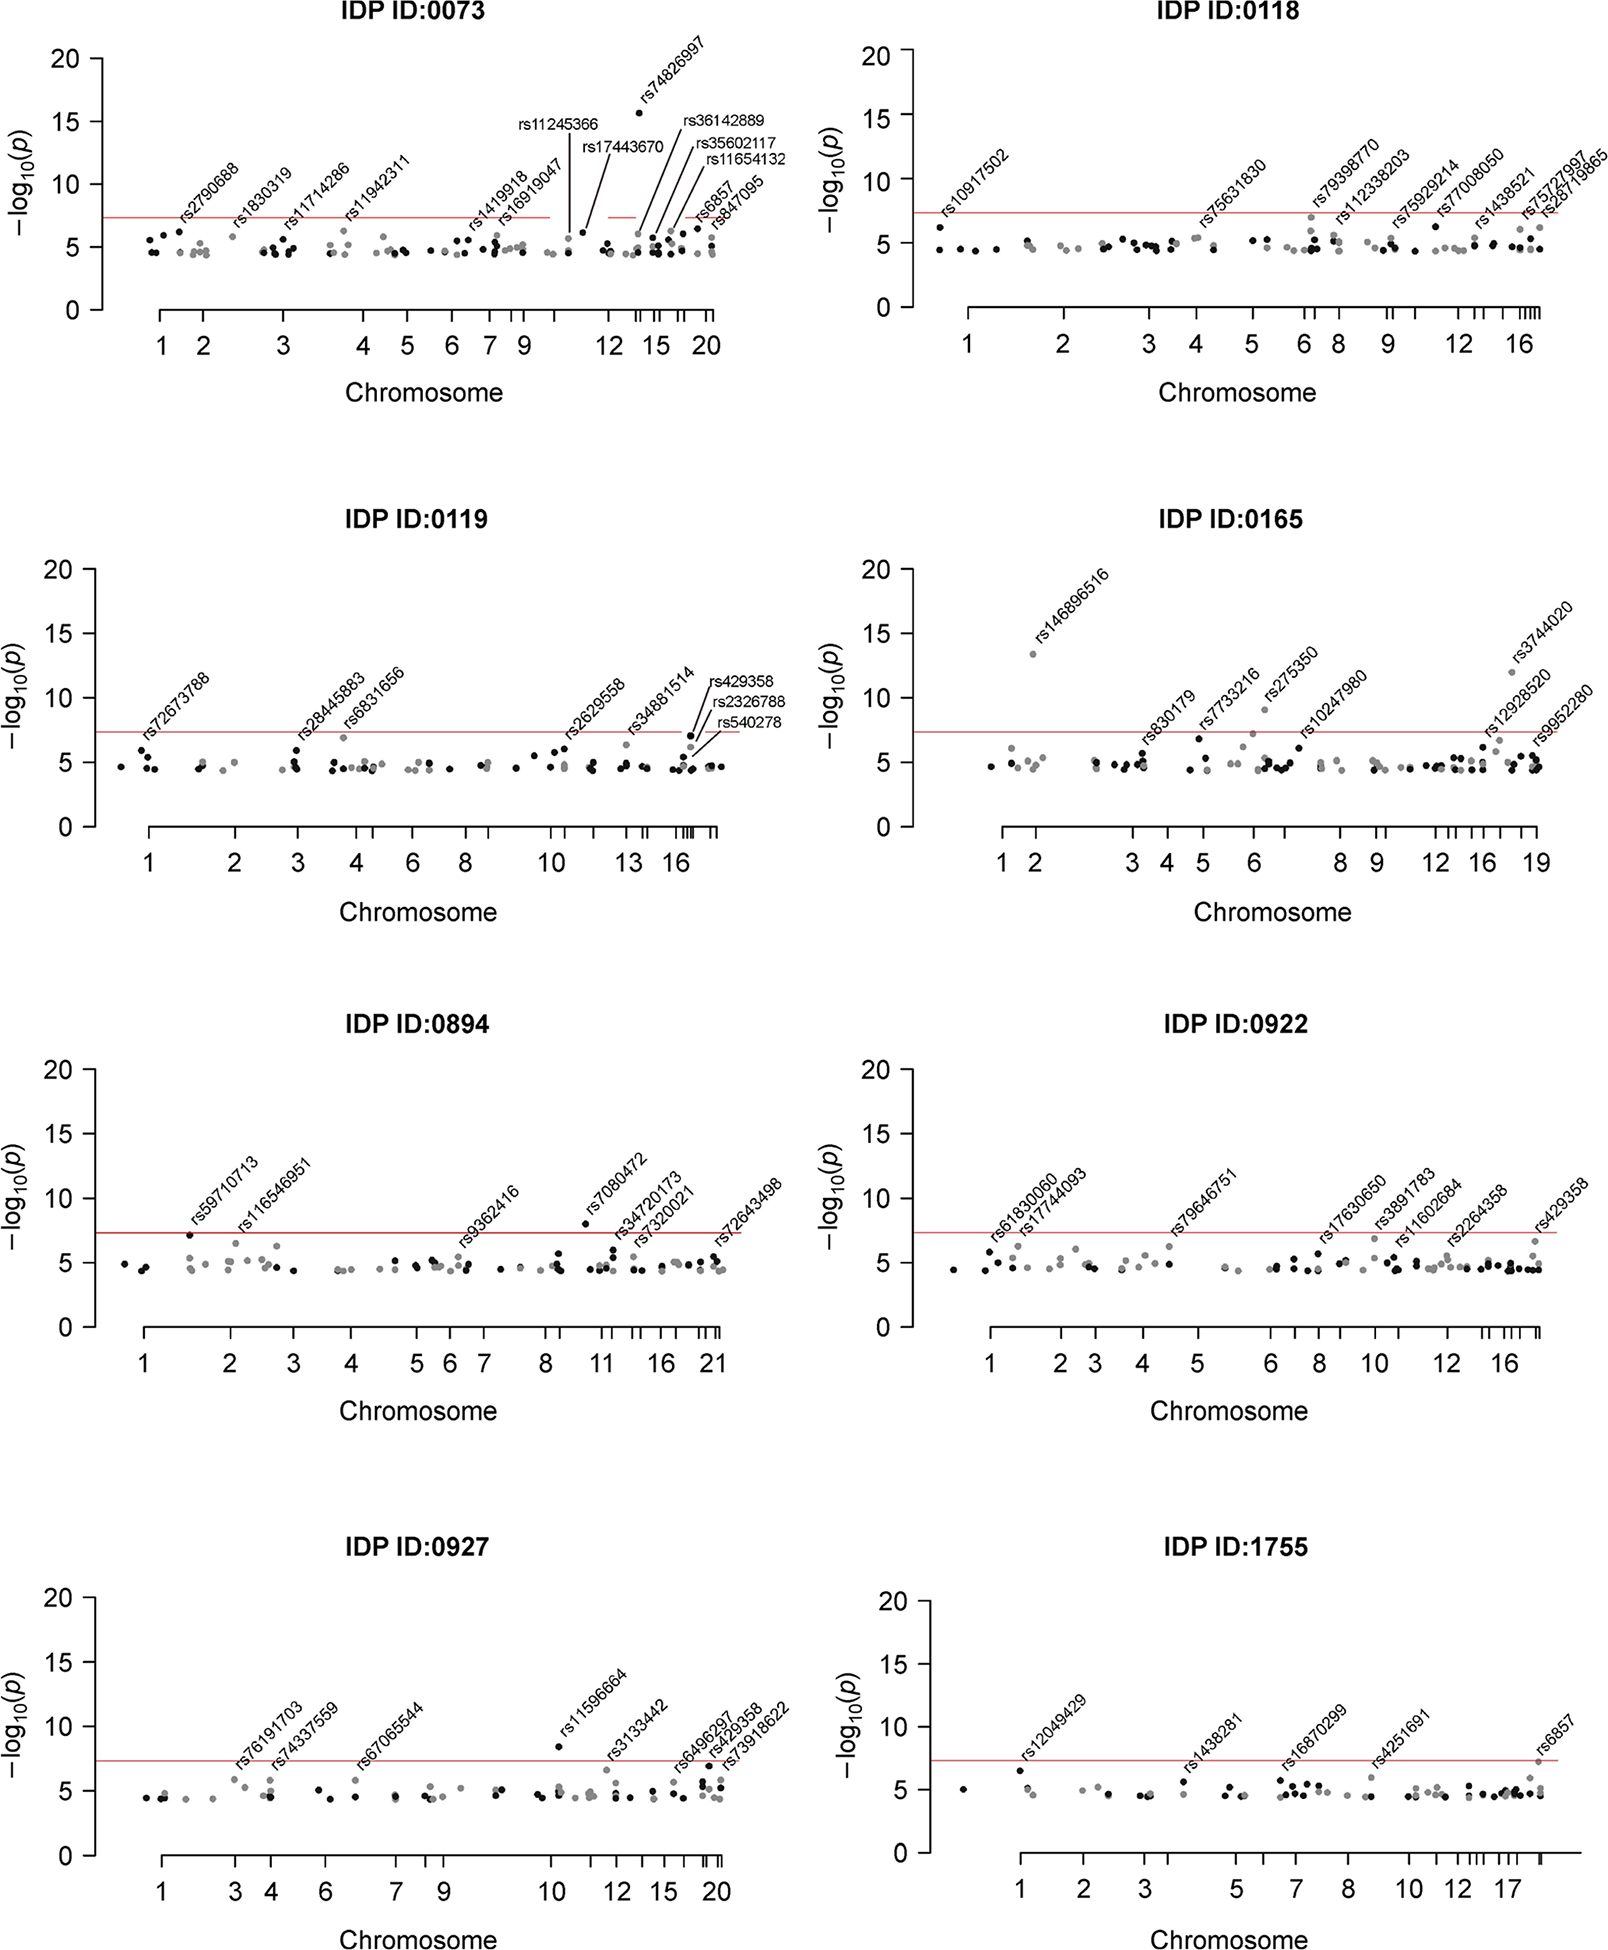
Figure 3. Manhattan plots for the 8 IDPs with significant tests for GSMR, Sum and aSPU tests.

All plotted SNPs have IDP GWAS marginal p < 5 × 10⁻⁵ and passed clumping at an LD cutoff of 0.1. The red line represents genome-wide significance (p < × 5 × 10⁻⁸).
