Figure 7.

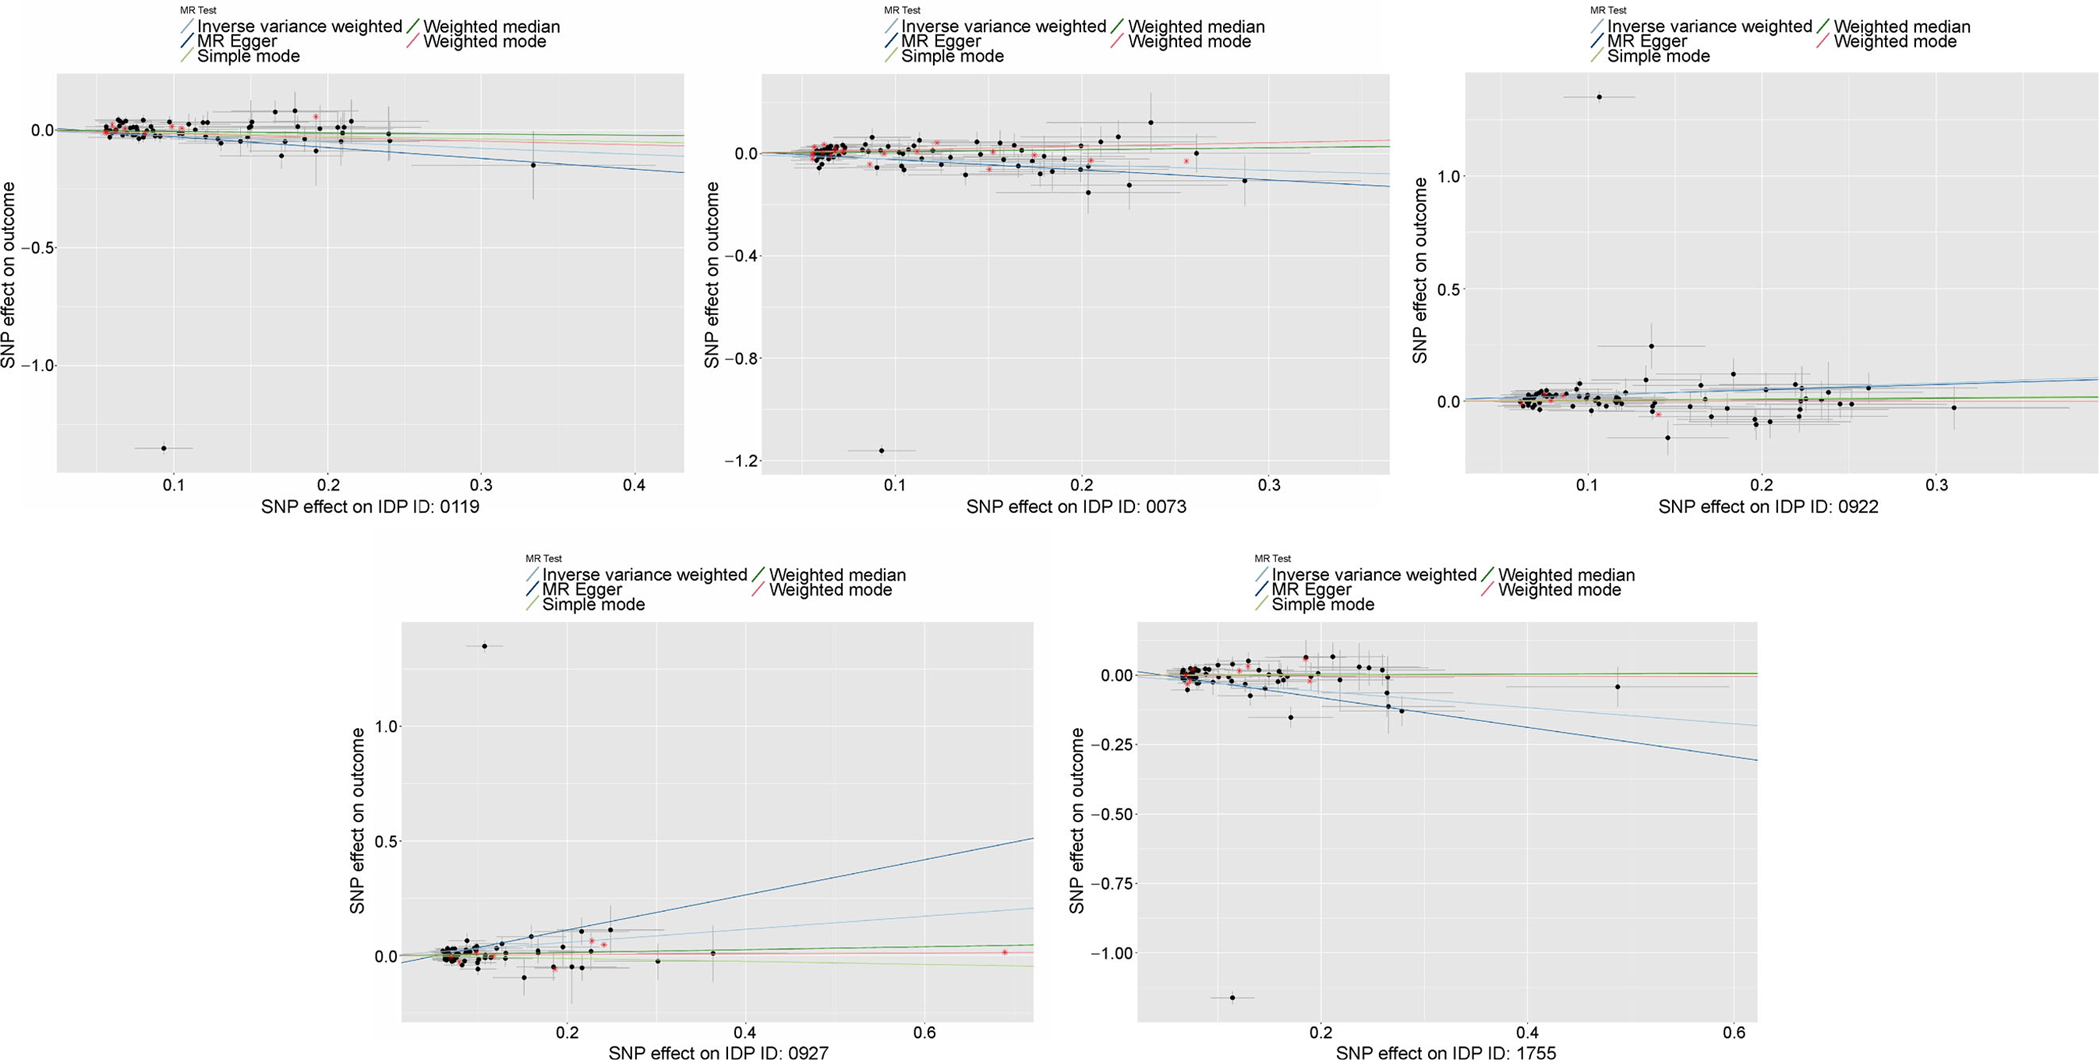
MR plots for 5 IDPs that were significant for all 3 SNP significance thresholds for at least 1 test, including effect estimates for SNPs excluded in 2SMR analysis but used in GSMR/aSPU analyses.

MR plots for 5 IDPs that were significant for all 3 SNP significance thresholds for at least 1 test, including effect estimates for SNPs excluded in 2SMR analysis but used in GSMR/aSPU analyses.