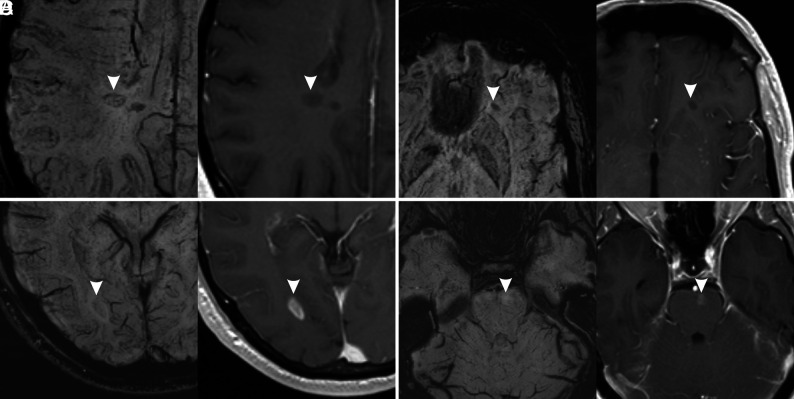
FIG 2.
Examples of MS lesions (arrowheads) with different signal patterns on SWI (left) and corresponding contrast-enhanced T1-weighted images (right). A, Hypointense ring. B, Marked hypointensity (dot-shaped). C, Mild hypointensity. D, Iso-/hyperintensity. Lesions in A and B do not show enhancement on postcontrast images, while lesions on C and D show enhancement on postcontrast images.

