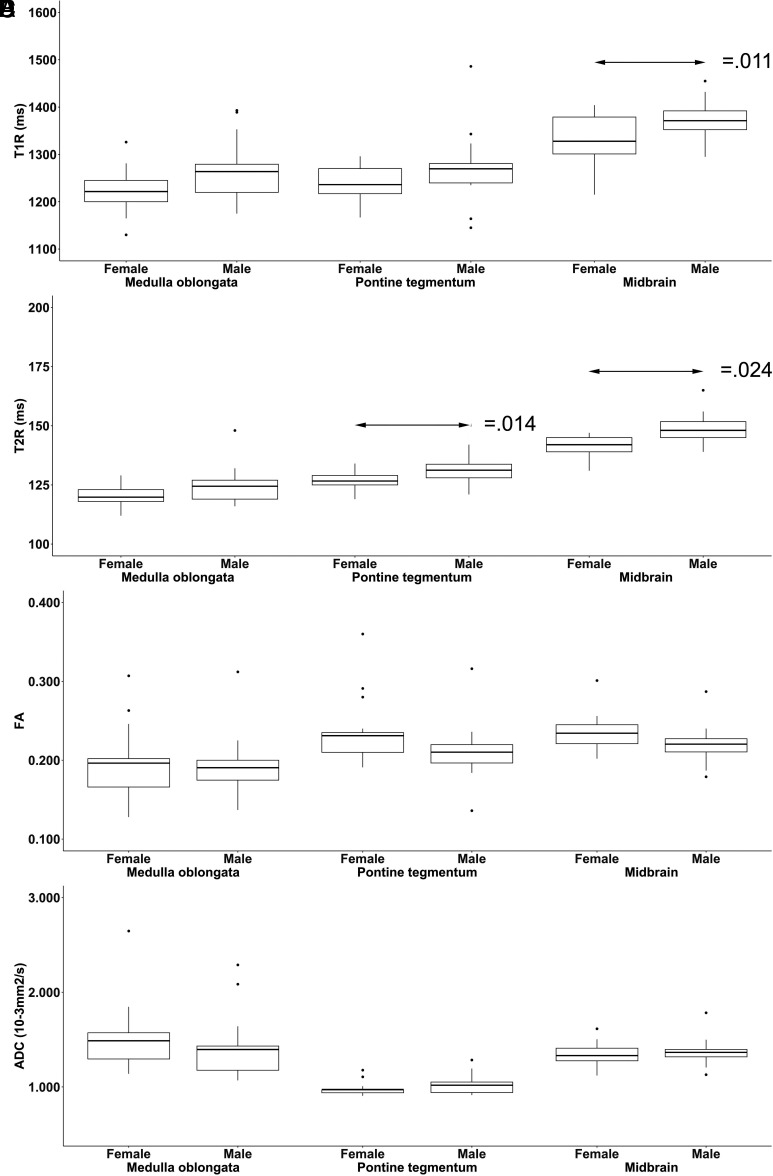
FIG 2.
The boxplots show sex-related differences in T1-/T2-relaxation time metrics (ms) (A and B) and diffusion tensor parameters (FA; ADC [10−3mm2/s]) (C and D) (determined by rater 1 at term-equivalent ages) of the neonatal medulla oblongata, pontine tegmentum, and midbrain. The black bar indicates mean values. Significant differences (arrows) were observed in T1R (P = .011) of the midbrain (A), T2R (P = .014) of the pontine tegmentum, and T2R (P = .024) of the midbrain (B) between female and male neonates.

