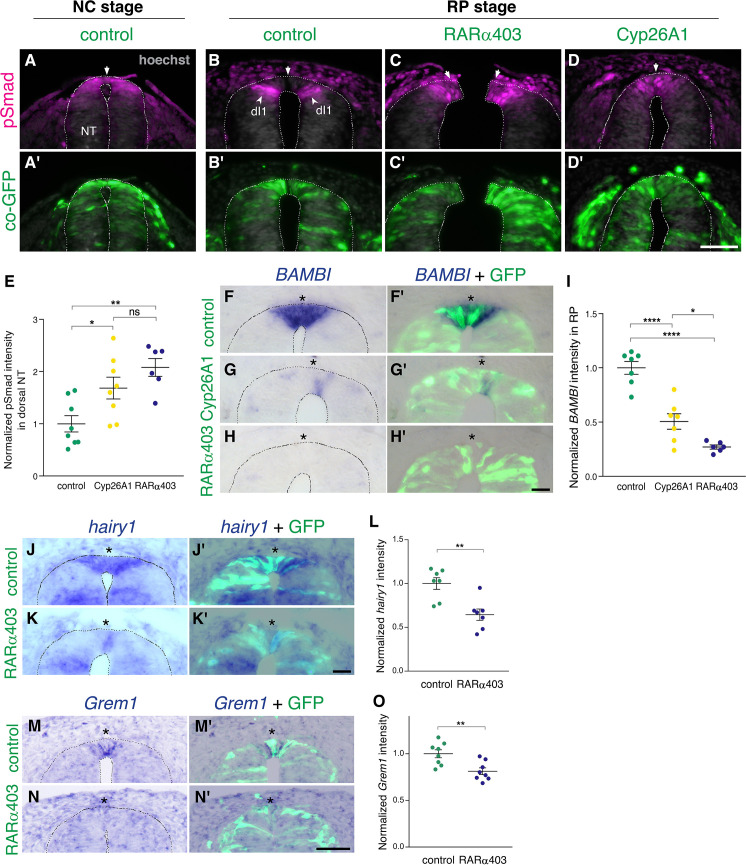
Figure 2. RA is responsible for the loss of sensitivity of dorsal NT progenitors to BMP during the transition from NC to RP.
(A-D’) Immunostaining for pSmad1/5/9. Embryos at E2.5 (27-8ss) were co-electroporated with RARα403, Cyp26A1 or with a control PCAGG vector, along with GFP, and analyzed at 35ss (control only, NC stage) and at E4. Note the presence of BMP activity in premigratory NC (A) and its absence in the RP of control embryos (N = 8, B-B’). Whereas only ventrally located dorsal interneurons are positive in control embryos, the RP domain itself is positive in Cyp26A1 (N = 8) and RARα403-electroporated embryos (N = 7, C-C',D-D'). (E) Quantification of pSmad staining intensity (measured area includes dorsal interneurons). Imaging and quantification were performed at somite levels 24–26. Four-to-21 sections per embryo were analyzed. *p < 0.05, **p < 0.005, one-way ANOVA with post-hoc Tukey’s tests. (F–O) In situ hybridization of embryos electroporated with Cyp26a1 or RARα403 at E2.5 (27 ss) and analyzed at E4. Asterisks mark the RP domain. (F–I) ISH for BAMBI, showing downregulation in the RP of Cyp26A1- and RARα403-treated embryos. (I) For quantification of the intensity of BAMBI, 6-to-21 sections per embryo were analyzed at somite levels 24–26. N = 7,7 and 6 embryos for control, Cyp26A1 and RARα403, respectively. *p < 0.05, ****p < 0.0001, one-way ANOVA with post-hoc Tukey’s tests. (J–L) ISH for hairy1, showing downregulation in the RP of RARα403-treated embryos. (L) For quantification of the intensity of hairy1, 7–18 sections per embryo were analyzed at somite levels 24–26. N = 7 embryos for each group. **p < 0.005, Student’s unpaired t-test. (M–O) ISH for Grem1, showing downregulation in the RP of RARα403-treated embryos. For quantification of the intensity of Grem1, 11–27 sections per embryo were analyzed at somite levels 24–26. N = 8 embryos for each group. **p < 0.005 via Student’s unpaired t-test. Abbreviations, dI1, dorsal interneurons 1, RP, roof plate. Scale bar, 50 μm.


