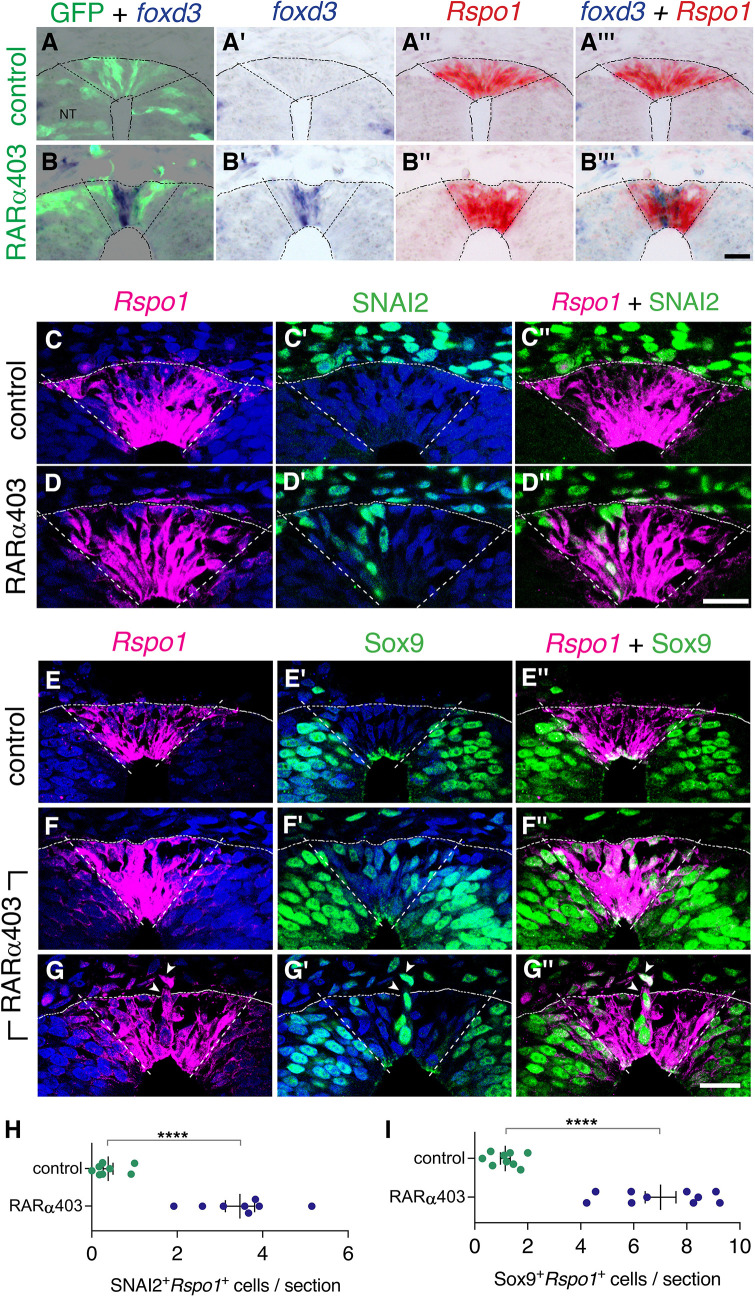
Figure 6. Overlapping expression in RP of both NC and RP markers upon inhibition of RA signalling.
(A-B’’’) Embryos co-electroporated at E2.5 (27ss) with either control PCAGG or RARα403 along with a GFP plasmid. Embryos were fixed at E4, and adjacent sections were in-situ hybridized for foxd3 or Rspo1 and then superimposed to reveal overlapping domains of gene expression. Dotted lines delineate the Rspo1 expression domain. In control embryos, no foxd3 expression was detected in the RP (N = 2, and see also Figure 3). In RARα403-treated embryos, overlapping expression was detected in all four embryos examined. Imaging and analysis were performed somite levels 24–26. (C-D”) Immunostaining for SNAI2 and fluorescent ISH for Rspo1 were combined on the same sections of embryos electroporated at E2.5 (27ss) with either control PCAGG or RARα403 and analyzed at E4. Dashed lines mark the Rspo1 expression domain. Note the presence of SNAI2+Rspo1+ cells in the RP in D”. (E-G”) Immunostaining for Sox9 and fluorescent ISH for Rspo1 were performed as above. Note the presence of Sox9+Rspo1+ cells in the RP in F” and G’’. Additionally, delaminating Sox9+Rspo1+ cells (arrowheads in G-G”) were apparent under experimental conditions. (H,I) Quantification of SNAI2+Rspo1+ and Sox9+Rspo1+ cells in the RP. Imaging and analysis were performed at somite levels 24–26. N = 8 and 8 for SNAI2 in controls and RARα403. N = 9 and 10 embryos for control and RARα403 groups stained with Sox9, respectively. ****p < 0.0001, Welch’s t-test. Abbreviations, NT, neural tube. Scale bar, 20 μm.


