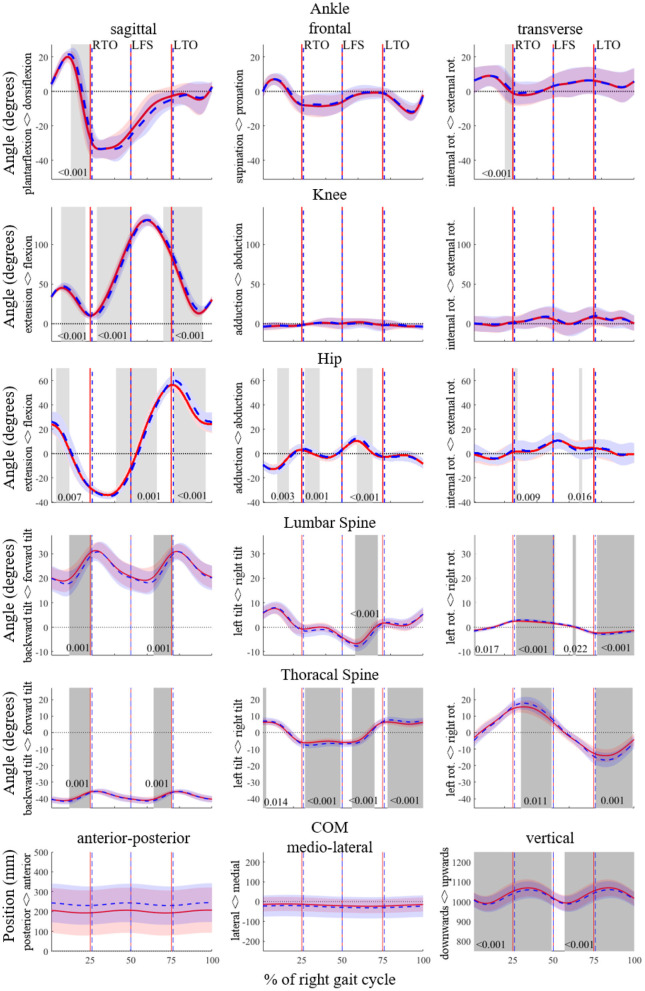
Figure 1.
SPM analyses for the angles of the ankle, knee, hip, lumbar spine and thoracic spine in degrees, and of the trajectory of the center of mass (CoM) in mm for the entire running gait cycle of the right leg (from right foot strike to right foot strike) in 3D. The PRE and POST time series data are shown in red and blue, respectively. Significant differences (p < 0.05) are highlighted with gray areas and corresponding p-values are given. RTO signifies right toe off; LFS, left foot strike; LTO, left toe-off.

