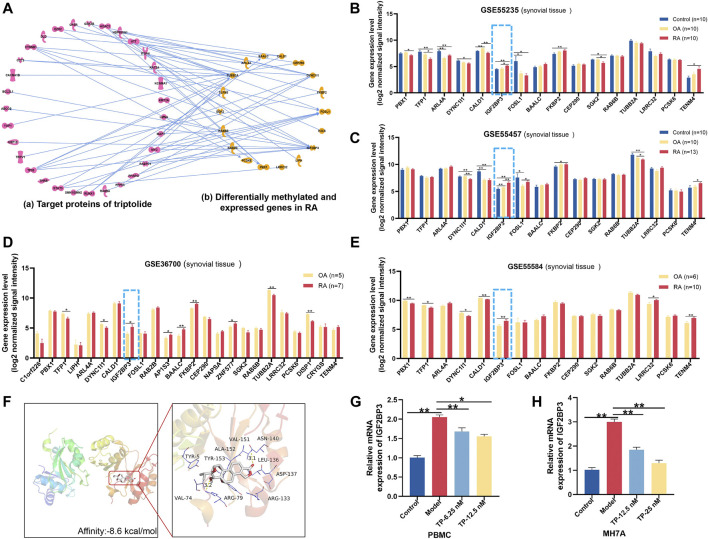
FIGURE 6.
Potential target analysis of TP. (A) Network analysis between genes with great variation in both the m6A modification and mRNA levels and target proteins of TP. (B–E) Gene expression of IGF2BP3 in synovial tissue samples of GEO datasets. (F) Molecular docking of IGF2BP3 and TP. In the picture on the right, thick sticks represent the TP molecule, and thin lines represent residues in the protein binding site. (G,H) mRNA expression of IGF2BP3 in PBMCs and MH7A. *p < 0.05, ** p < 0.01. TP, triptolide; IGF2BP3, insulin-like growth factor 2 mRNA-binding protein 3; GEO, Gene Expression Omnibus; and PBMCs, peripheral blood mononuclear cells.

