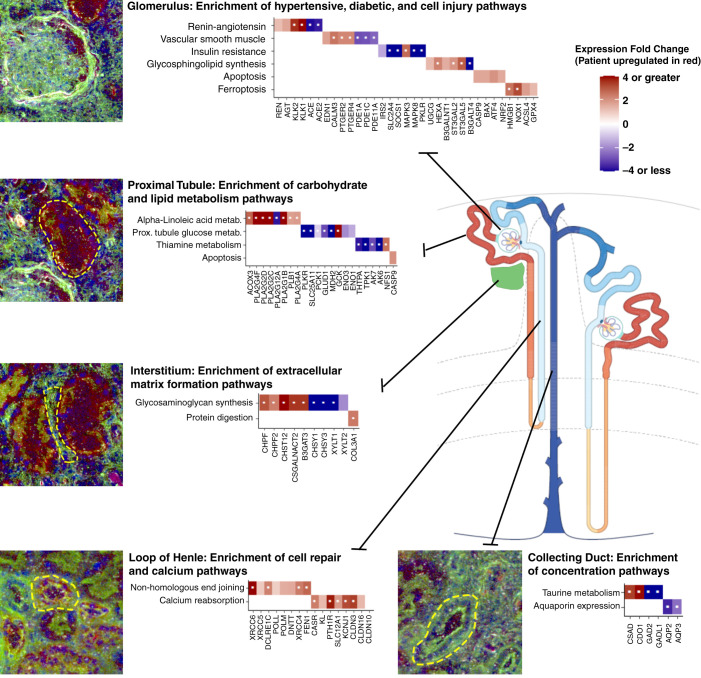
Figure 4.
Pathways and differentially expressed genes identified through regional transcriptomics. Key enriched pathways and related significant genes are depicted for each segment of the nephron and the kidney interstitium. Genes upregulated in our participant as compared with the reference nephrectomies are depicted in red. Genes downregulated are depicted in blue. Each gene depicted passed an arbitrary significance threshold of P<0.05 (except claudin-10 [CLDN10], which is depicted as a comparison). Genes labeled with a white dot passed a false discovery rate–corrected significance threshold of P<1.98 x 10⁻⁶. Immunofluorescence inset images are provided from laser microdissection microscopy. In all images, blue is DAPI (4′,6-diamidino-2-phenylindole), and green is FITC (fluorescein)-phalloidin, which labels F-actin. In the glomerulus, proximal tubule, and interstitium insets, the red channel is megalin (LDL receptor-related protein 2 [LRP2]) labeling proximal tubules. In the loop of Henle and collecting duct insets, the red channel is Tamm–Horsfall protein (uromodulin [UMOD]), which labels the loop of Henle.

