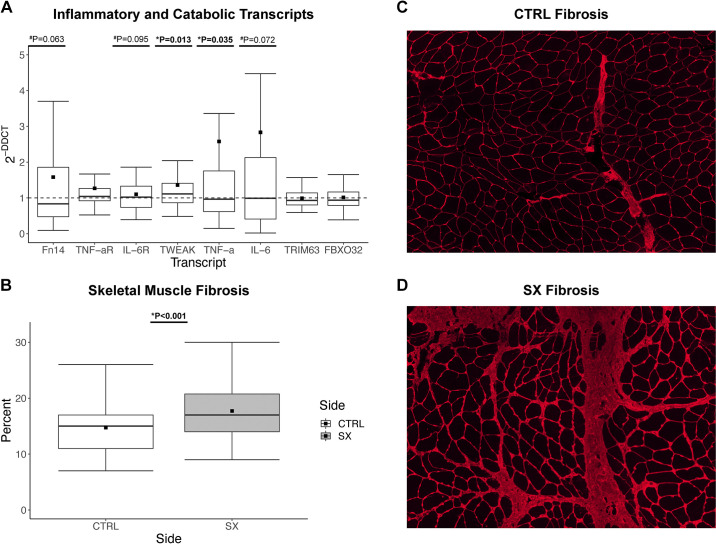
Figure 1.
The influence of end-stage osteoarthritis on gene expression and skeletal muscle fibrosis. A: fold difference in expression of proinflammatory and catabolic skeletal muscle genes between contralateral (CTRL) and surgical (SX) limbs; boxplots represent SX gene expression relative to CTRL, while the –– line represents CTRL gene expression (n = 70). B: percent skeletal muscle fibrosis between the CTRL and SX limbs (n = 62). C: representative image of CTRL skeletal muscle fibrosis. D: representative image of SX skeletal muscle fibrosis. Boxplots = median (solid line), mean (square), box-ends = 1st and 3rd quartile, whiskers = ±1.5 interquartile range. *Significant P < 0.05. #Trend P < 0.1.

