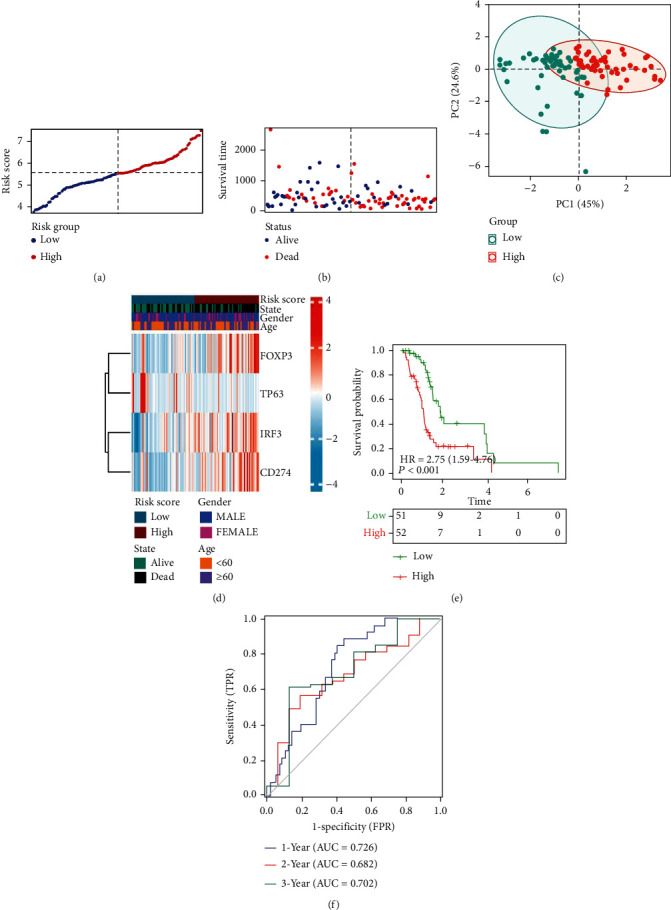
Figure 3.

Training cohorts to develop predictive DEG-based risk models. (a) The distribution and split point of the risk scores in the training cohort. (b) The OS of the risk scores in the training cohort. (c) PCA plot of the training cohort proved the feasibility of grouping. (d) The heat map of differences in the expression of 4 genes in the high- and low-risk groups of training cohorts. (e) In the training cohort, KM curves showed a better prognosis of patients in the low-risk group. (f) The area under the time-dependent ROC curves validated the accuracy of the risk score in predicting prognosis in the training cohort.
