
Figure 6.
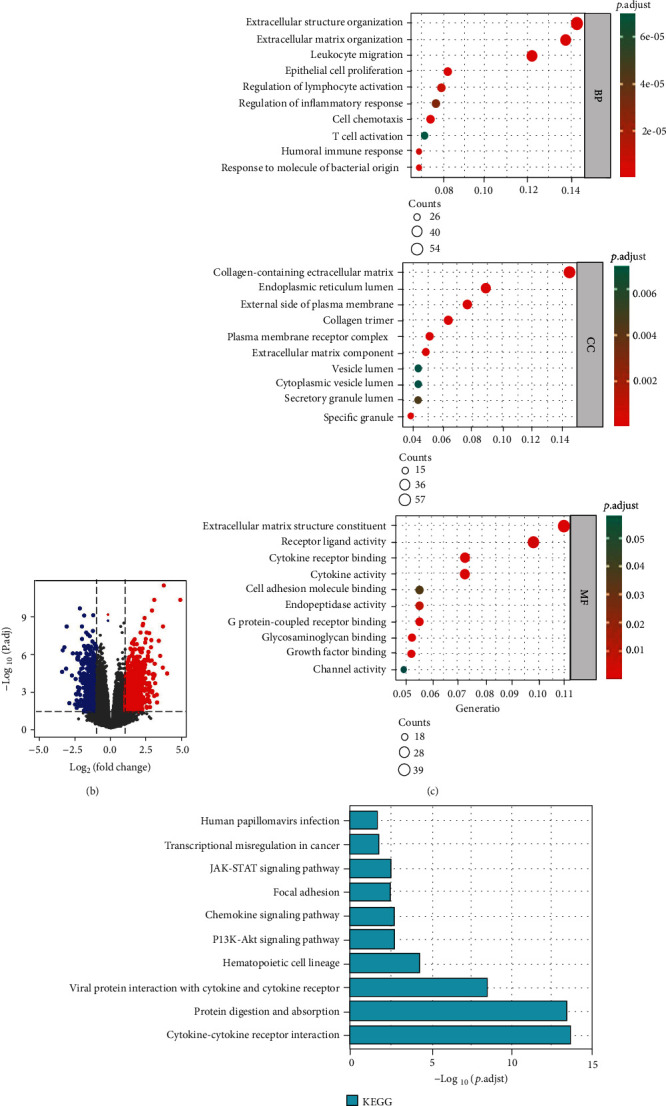
Functional enrichment analysis. (a) Correlation of each of the 4 genes related to pyroptosis and TMZ resistance with immune infiltrating cells. (b) Volcano plot depicting DEGs in the high- and low-risk groups in the training cohort. (c) GO analysis suggested a considerable enrichment of DEGs in immune-related biological processes (BP). (d) KEGG analysis indicated that DEGs were enriched in immune-related pathways. (e) Chord diagram of KEGG. ∗p < 0.05; ∗∗p < 0.01; ∗∗∗p < 0.001; ns p > 0.05.