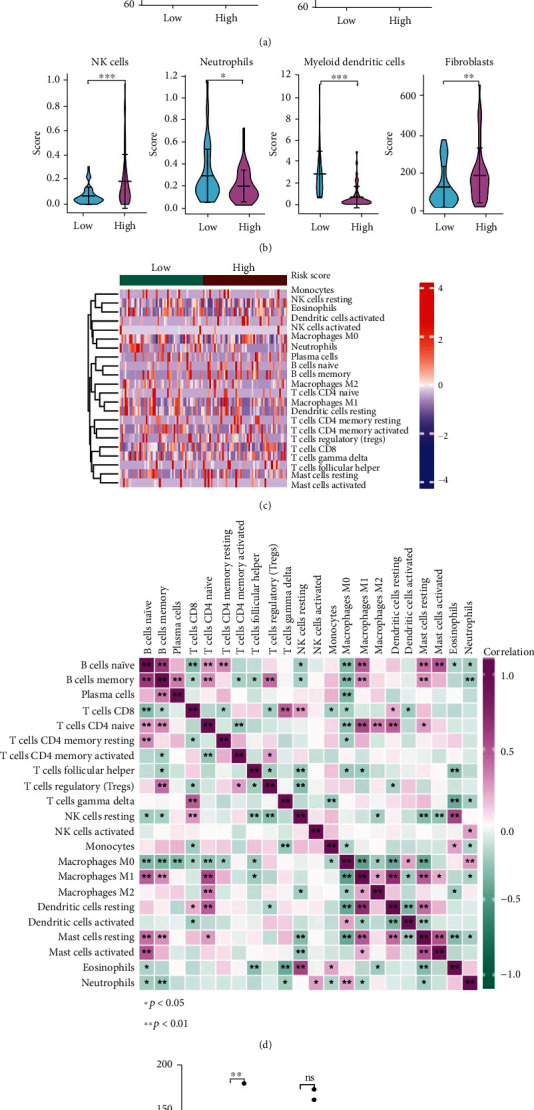
Figure 7.

Immune analysis for high- and low-risk groups based on training cohort. (a) Estimation of STromal and Immune cells in MAlignant Tumor tissues (ESTIMATE) algorithm. (b) The violin plot revealed the abundance of the 4 types of immune cells. (c)–(d) Heat map of the situation and correlation of tumor-infiltrating immune cells. (e) The expression levels of immune checkpoints in high- and low-risk groups. ∗p < 0.05; ∗∗p < 0.01; ∗∗∗p < 0.001; ns p > 0.05.
