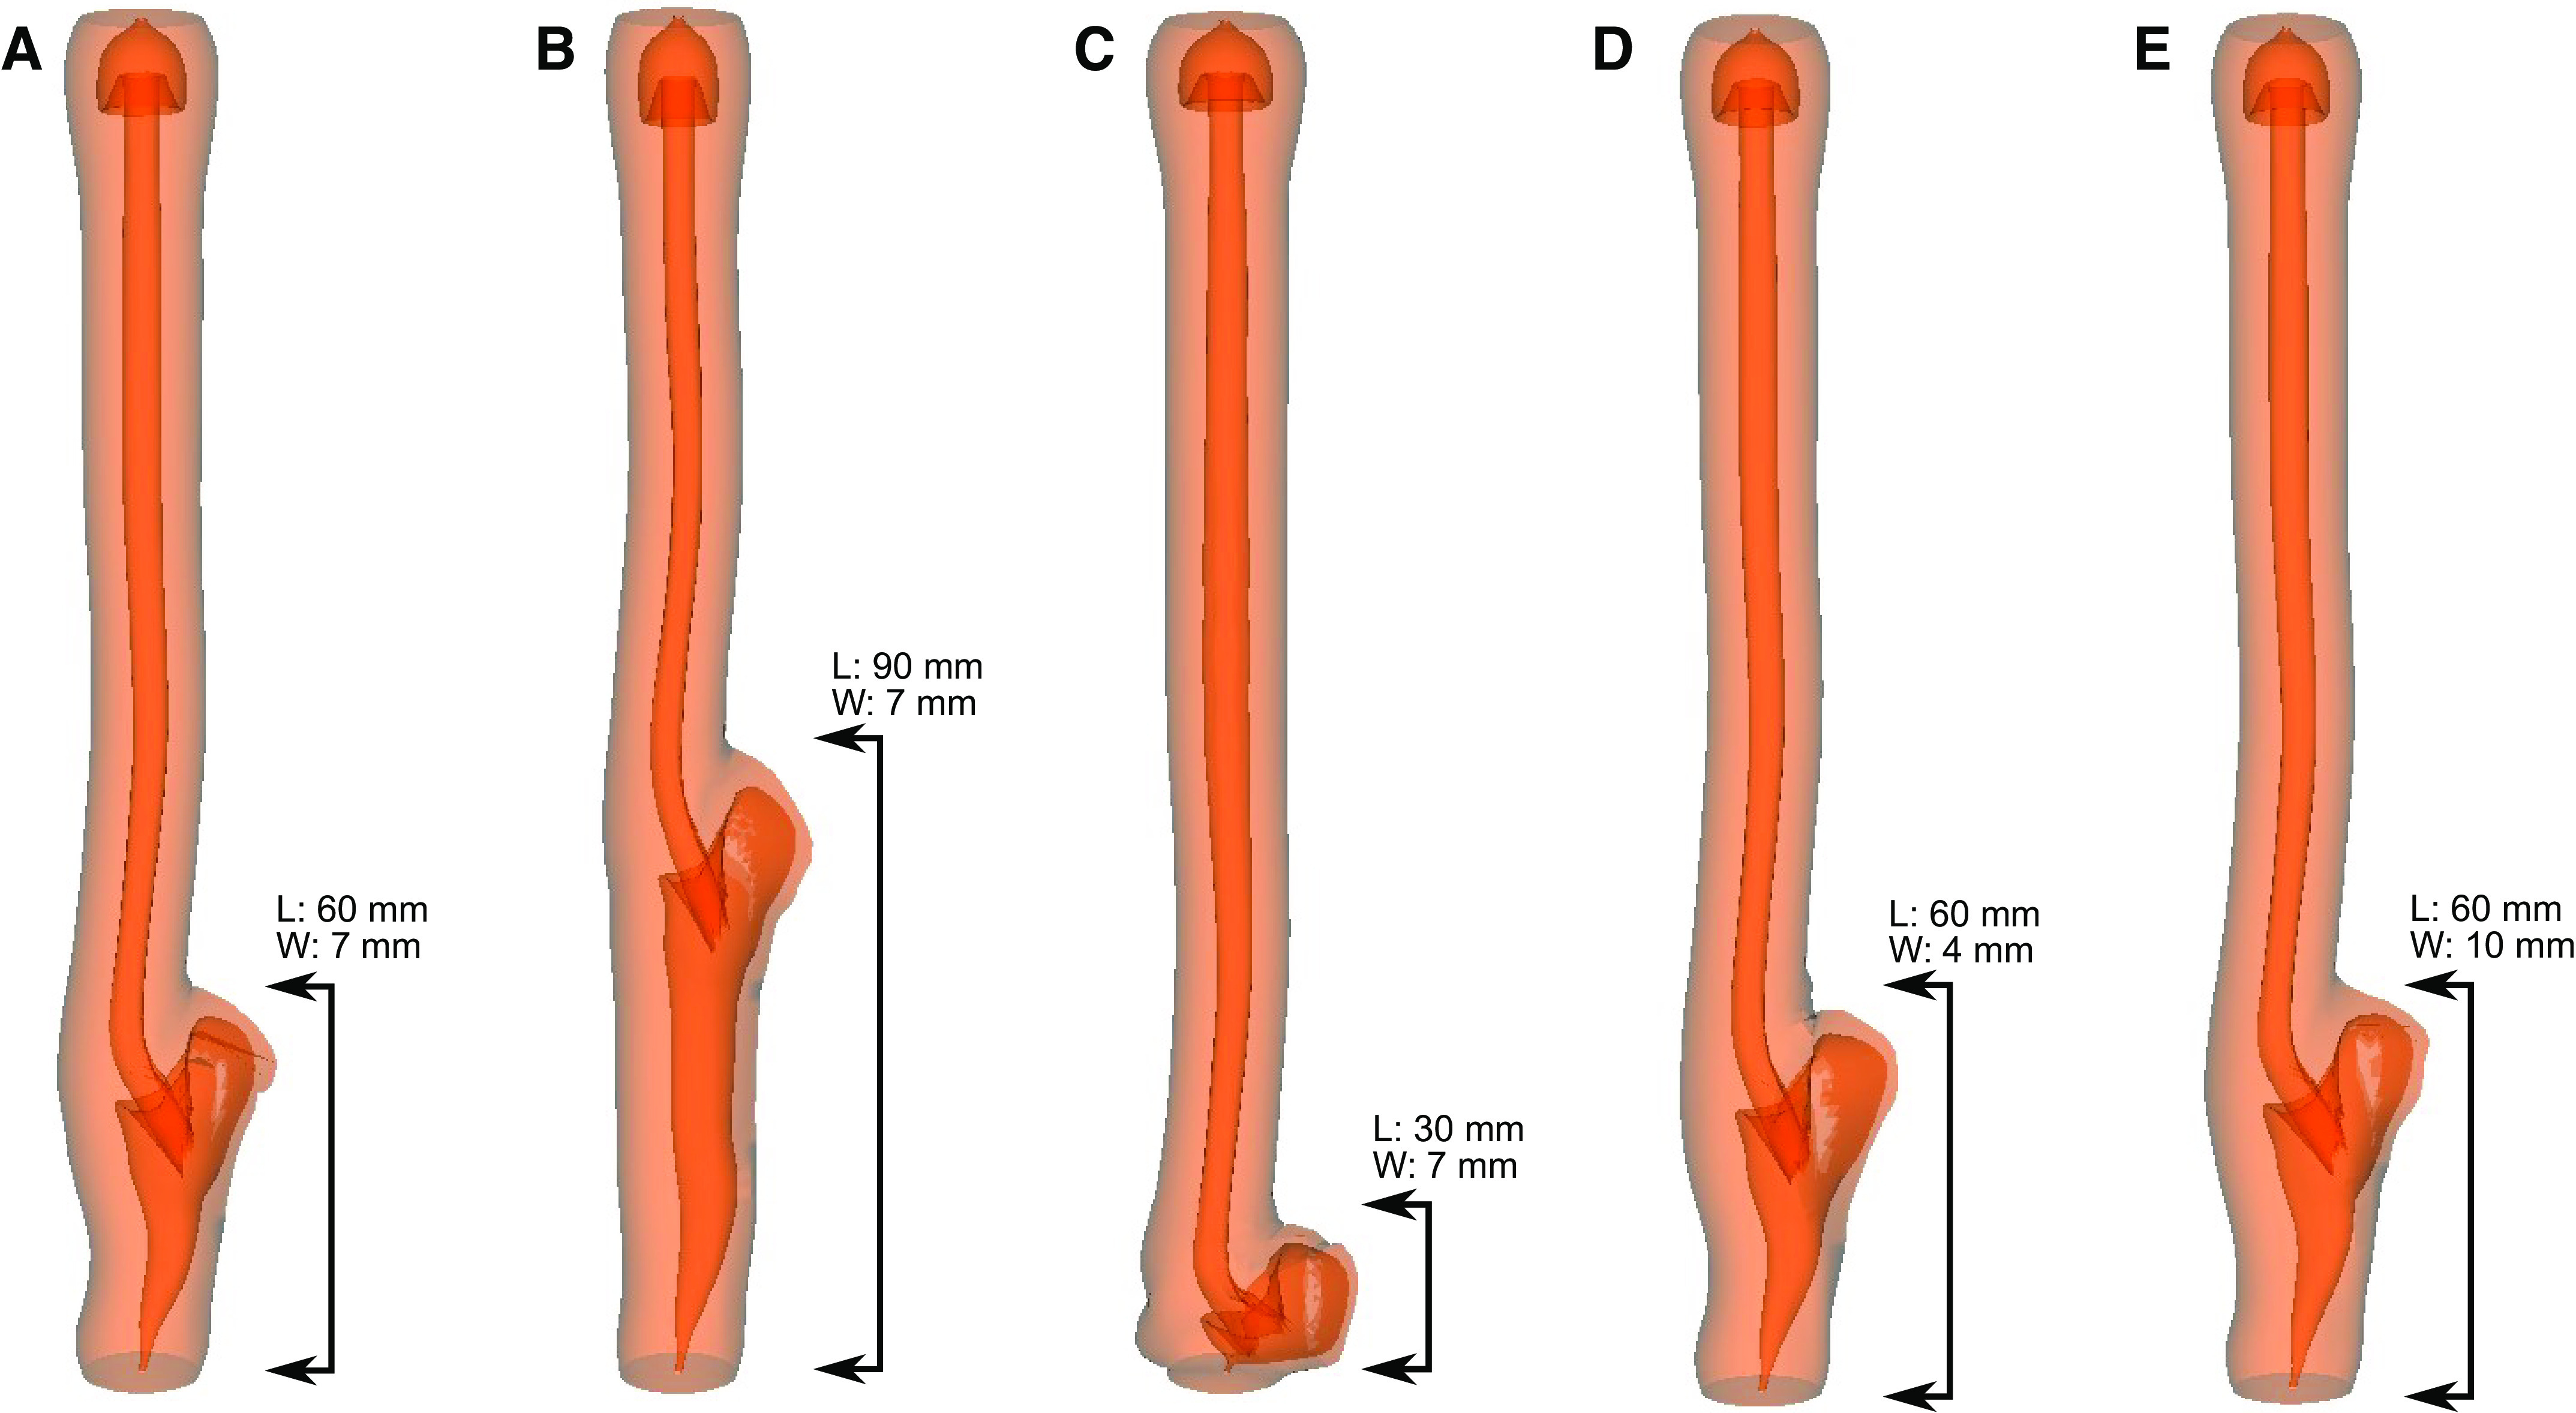
Figure 2.

Simulation set 1: myotomy site deformation with different dimensions of myotomy. A: length 60 mm, max width 7 mm. B: length 90 mm, max width 7 mm. C: length 30 mm, max width 7 mm. D: length 60 mm, max width 4 mm. E: length 60 mm, max width 10 mm. A–E shows the deformed shape of the esophagus for cases 1–5, respectively at the same time instant. The maximum outward displacement at the myotomy site for cases 1–5 is 9.5 mm, 9.2 mm, 9.3 mm, 9.6 mm, and 9.7 mm, respectively. The percentage volume of fluid accumulated at the myotomy affected regions with respect to the total bolus volume for cases 1–4 is 48.6%, 67.6%, 28.7%, 48.8%, and 48.4%, respectively.
