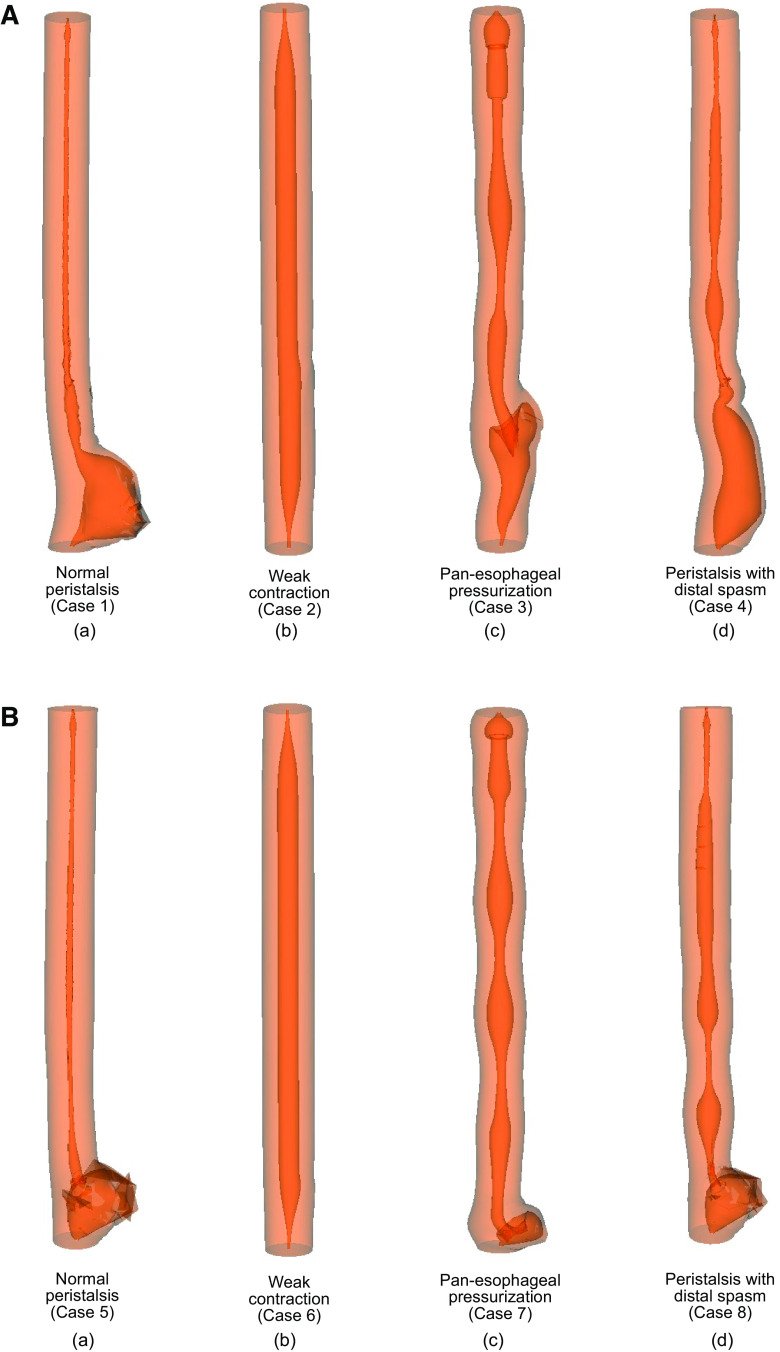
Figure 3.
Simulation set 2: effect of contraction pattern on maximal myotomy site deformation. A: standard myotomy (=6 cm). The maximum outward displacement at the myotomy site for cases 1–4 are 18.0 mm, 0.4 mm, 5.9 mm, and 7.4 mm, respectively. The percentage volume of fluid accumulated at the myotomy affected regions with respect to the total bolus volume for cases 1–4 is 95.1%, 29.9%, 46.5%, and 81.7%, respectively. B: short myotomy (=3 cm). The maximum outward displacement at the myotomy site for cases 5–8 is 9.4 mm, 0.4 mm, 7.5 mm, and 12.8 mm, respectively. The percentage volume of fluid accumulated at the myotomy affected regions with respect to the total bolus volume for cases 5–8 is 87.7%, 0.33%, 16.2%, and 57.2%, respectively.

