Figure 4.
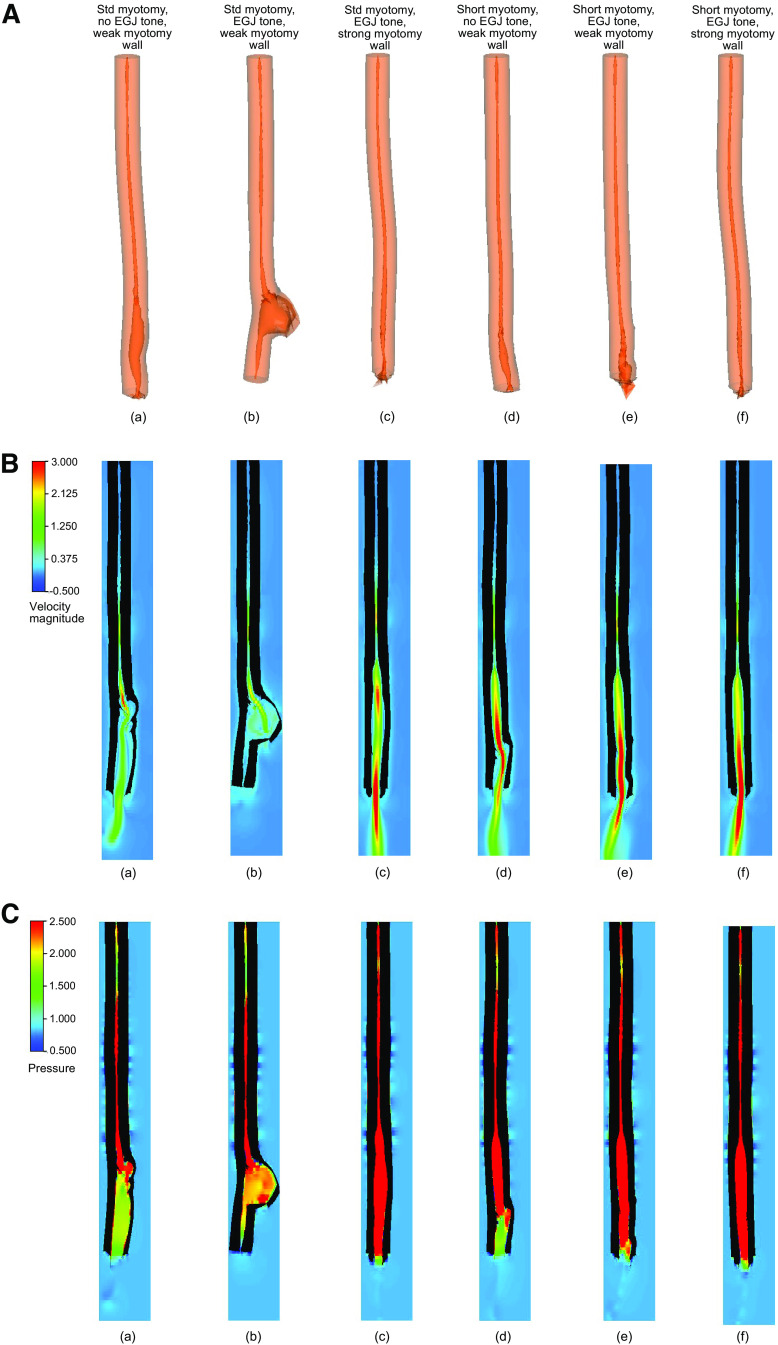
Simulation set 3 (group I): effect of EGJ tone and myotomy site muscle architecture on myotomy site deformation. A: a–f) myotomy deformation associated with cases 1–6, respectively. The esophagus empties in all the cases except case 2 with very little deformation at the myotomy site. The esophagus in case 2 has negligible emptying and the bolus accumulates in the myotomy site proximal to the EGJ. The volume of the bolus inside the esophagus at the end of the simulation for cases 1–6 is 37.9%, 98.1%, 15.0%, 15.9%, 13.3%, and 11.5% of the initial bolus volume, respectively. B: nondimensional velocity distribution within the esophagus with a myotomy at the same time instant. a–f illustrate cases 1–6, respectively. All the cases except case 2 show bolus emptying evident from the high fluid flow rate at the distal end of the esophagus. In case 2, only a negligible amount of bolus fluid leaves the esophagus and most of it stays accumulated at the myotomy site. C: nondimensional pressure distribution within the esophagus with a myotomy at the same time instant. a–f illustrate cases 1–6, respectively. The intrabolus pressure (IBP) is higher in case 2 than in case 1. The average IBP in case 2 is 33% higher than case 1. Cases 3–6 have significantly higher IBP. The IBP of cases 3–6 is 7.3, 7.4, 8.1, and 8.9 times that of case 1, respectively. EGJ, esophagogastric junction.

