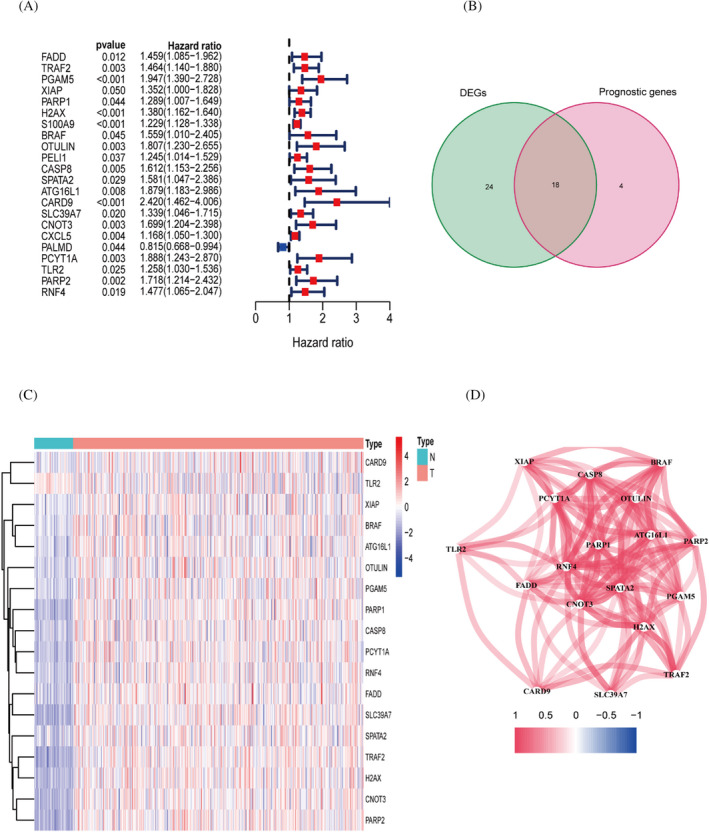
FIGURE 1.

Identification of genes differentially expressed in different tissues in relation to prognosis. (A) Univariate COX analysis of prognosis‐related genes. (B) The intersection portion of the Wayne plot shows 18 differentially expressed genes associated with prognosis. (C) Heat map showing differential expression of genes. (D) Correlation graph between genes
