FIGURE 2.

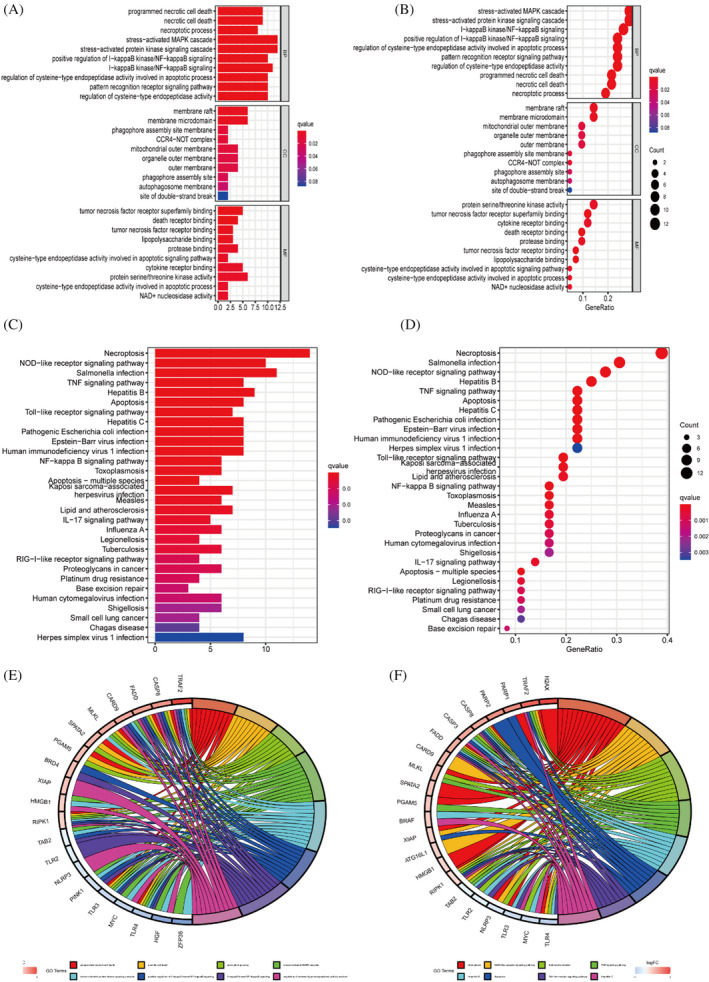
Gene enrichment and pathway analysis. (A,B) Gene ontology enrichment analysis. (C,D) KEGG analysis with these differential genes was enriched in Necroptosis, TNF signalling pathway. (E,F) Circle diagram for GO and KEGG analysis

Gene enrichment and pathway analysis. (A,B) Gene ontology enrichment analysis. (C,D) KEGG analysis with these differential genes was enriched in Necroptosis, TNF signalling pathway. (E,F) Circle diagram for GO and KEGG analysis