FIGURE 9.

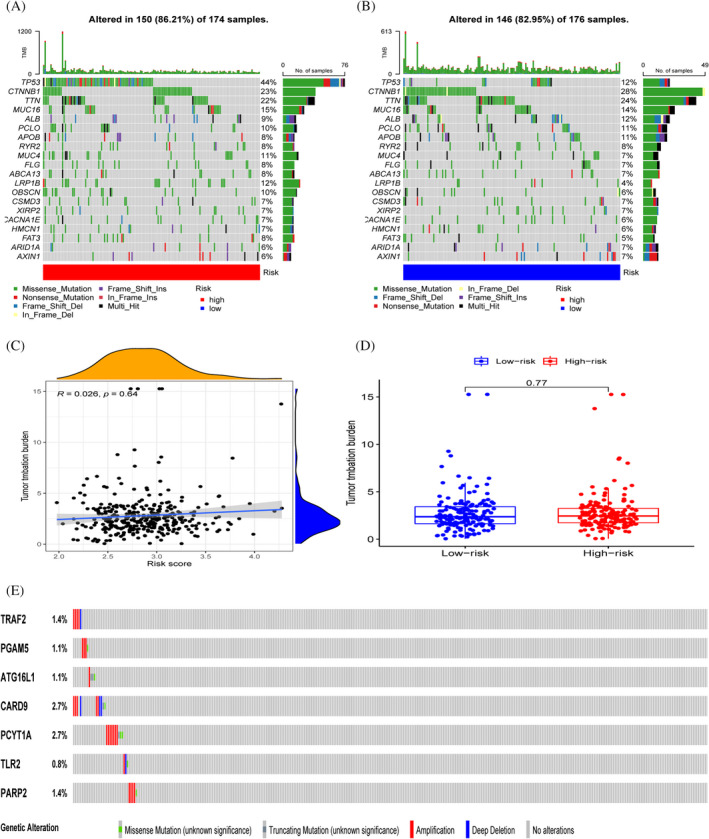
Genetic mutation landscape. (A‐B) TP53, CTTNB1 and TTN had the highest number of mutations in both groups. (C,D) Relationship between tumour mutation burden and risk score. (E) Mutation of model genes between samples

Genetic mutation landscape. (A‐B) TP53, CTTNB1 and TTN had the highest number of mutations in both groups. (C,D) Relationship between tumour mutation burden and risk score. (E) Mutation of model genes between samples