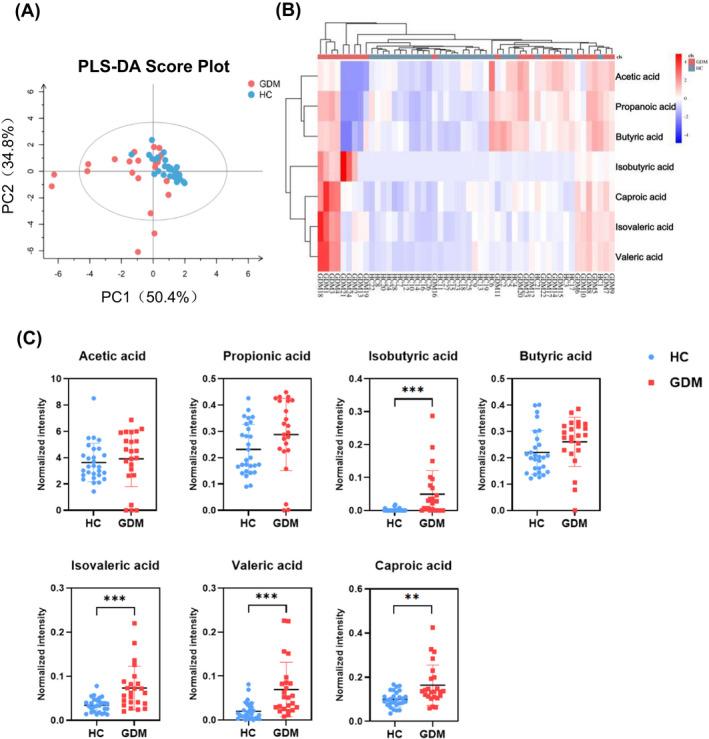
FIGURE 1.

Changes in serum short‐chain fatty acids (SCFAs) of GDM and HC. (A) The PLS‐DA scores plot of SCFAs in serum samples of the GDM group (red) and HC group (blue). The horizontal axis represents the predicted score of the first component, which explained 50.4% of the between‐group variations. The vertical axis represents the orthogonal principal component score, which explained 34.8 of the within‐group variations. R2X = 0.853, R2Y = 0.301, Q2 = 0.245. (B) Heatmap analysis of SCFAs between the GDM and HC groups. Hierarchical clustering analysis was performed on each group, different color regions represent different clustering group information. Red indicates relatively high kurtosis values, and blue indicates relatively low kurtosis values. (C) Quantitative comparison of serum SCFAs between the GDM and HC groups. **p < 0.01, ***p < 0.001
