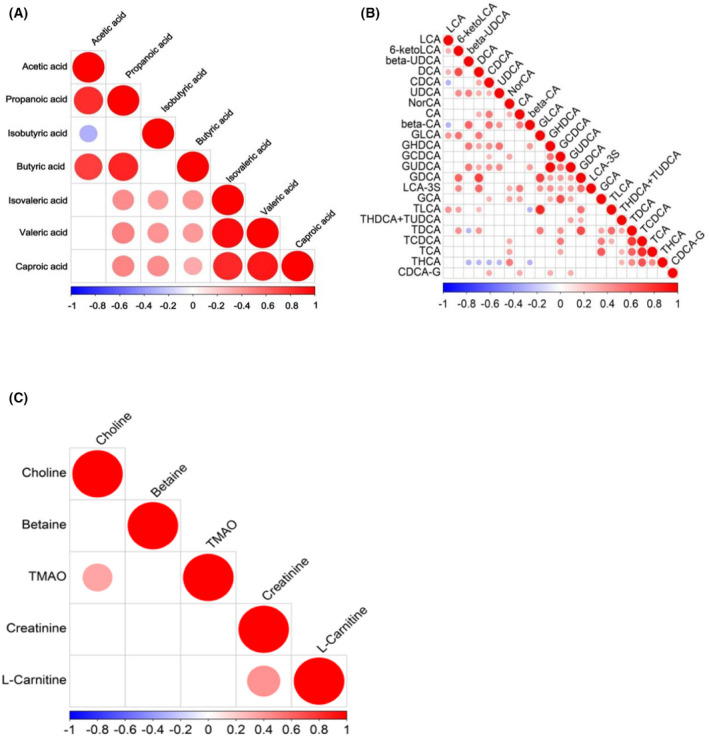
FIGURE 5.

Associated heatmap of gut microbiota‐derived metabolites. (A–C) When the linear relationship of the two metabolites is enhanced, the correlation coefficient tends to 1 or −1. The correlation is a maximum of 1, a complete positive correlation (red), a correlation of −1, and a complete negative correlation (blue)
