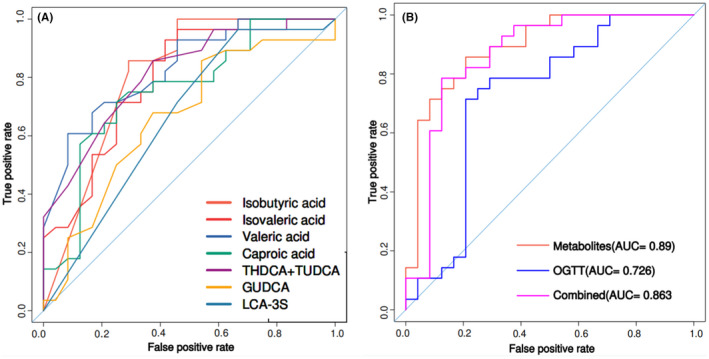
FIGURE 7.

Area under the curves of differential metabolites between the GDM and HC groups. (A) ROC curves were prepared for different metabolites. The ordinate is the sensitivity, which represents the true positive rate, and the abscissa is the specificity, which represents the false positive rate. (B) Random forest analysis was used to quantify diagnostic performance of biomarker panels. Individual marker panels could distinguish patients with the GDM and HC groups with an area under the curve (AUC) ranging from 0.726 to 0.890. AUC, area under the curve; ROC, receiver‐operating characteristic
