
FIGURE 3.
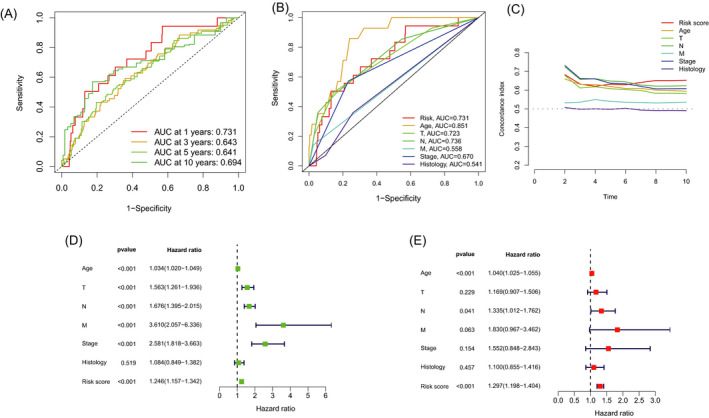
Verification of prognosis risk assessment model. (A) The 1‐, 3‐, 5‐, and 10‐year ROC curves of the complete sets. (B) The ROC curves of risk score and clinicopathologic features. (C) The C‐index curves of risk model. (D) Uni‐Cox analyses of clinicopathologic factors and risk score with OS. (E) Multi‐Cox analyses of clinicopathologic factors and risk score with OS