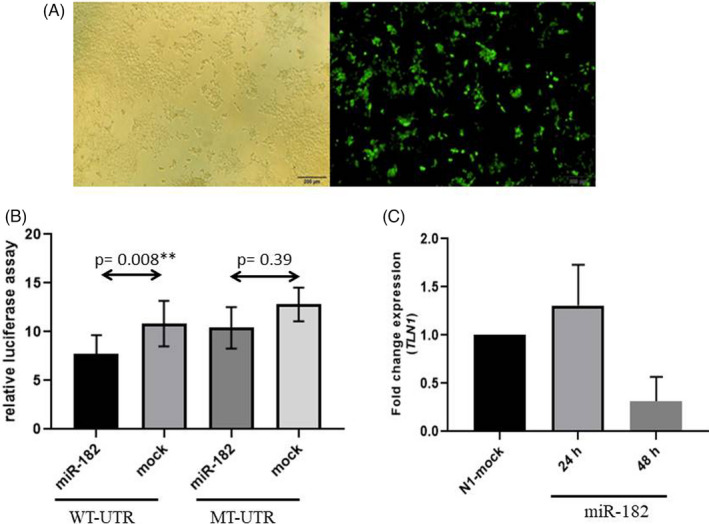
FIGURE 3.

Image presents the luciferase assay results. (A) HEK293T transfection is illustrated herein. The green fluorescent protein (GFP) signal shows that the pEGFP‐N1 vector is functional. (B) Relative luciferase activity is decreased in wild‐type 3′ ‐UTR (WT‐UTR) (p = 0.008) after miR‐182‐5p overexpression, but no significant alterations are observed in relative luciferase activity when the miR‐182‐5p target site is deleted from 3′ ‐UTR (MT‐UTR) (p = 0.39). (C) The miR fold change in the talin‐1 (TLN1) gene is shown herein after miR‐182‐5p overexpression in the HEK293T cell line. There is a decline in the TLN1 miR level after the overexpression in the miR 48 hours after transfection. The GAPDH gene was used as an internal control for TLN1 expression normalization. The bars represent the mean ± SEM
