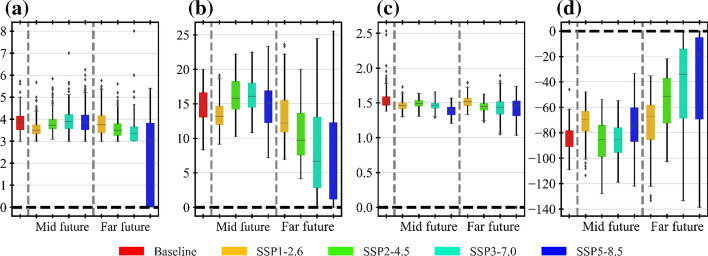
Fig. 11.
Boxplot of drought characteristics during the baseline period, mid-future (2041–2070) and far-future (2071–2100) under four selected scenarios over East Africa. a DD, b DF, c DI and d DS. The boxes show the interquartile range, the horizontal lines represent the median and the whiskers show the maximum/minimum value of the lower/upper quartile. The dots are outliers

