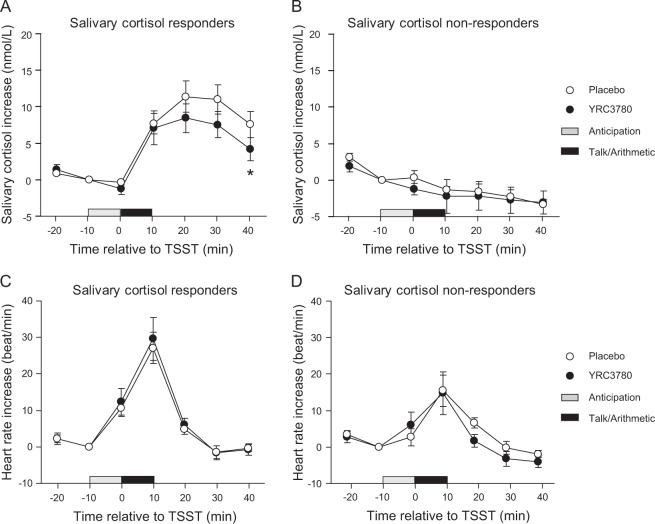
Fig. 3. Salivary cortisol concentration and heart rate responses before and after the Trier Social Stress Test (TSST) in the placebo and YRC3780 groups.
Data are expressed as mean ± SEM. A and C Indicate the salivary cortisol and heart rate increases in the salivary cortisol responders (placebo, n = 7; YRC3780, n = 8), while (B) and (D) indicate these values in the non-responders (placebo, n = 6; YRC3780, n = 6). Open and closed circles indicate data from the placebo and YRC3780 groups, respectively. Grayed and closed horizontal bars indicate 10 min anticipation and 10 min TSST period. *p < 0.05 vs. placebo using the Mann–Whitney U test.

