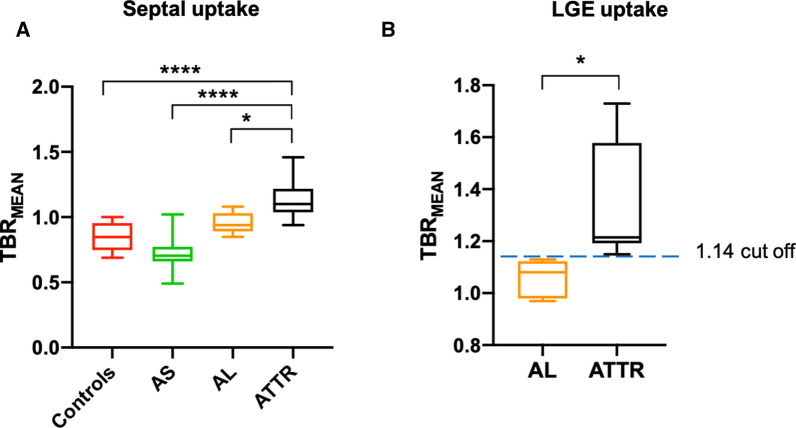
Figure 3.
Comparison of myocardial TBRMEAN across all cohorts and both subtypes of cardiac amyloid. TBRMEAN in graph A allows differentiation between ATTR and all cohorts. Further differentiation between amyloid subtypes can be appreciated in graph B with TTR displaying greater uptake than AL. Moreover, within areas of LGE, a cut-off value of > 1.14 gives 100% sensitivity and 100% specificity to detect ATTR over AL. Ordinary one-way ANOVA and unpaired t test. *< 0.05, **< 0.01, ***< 0.001, ****< 0.0001

