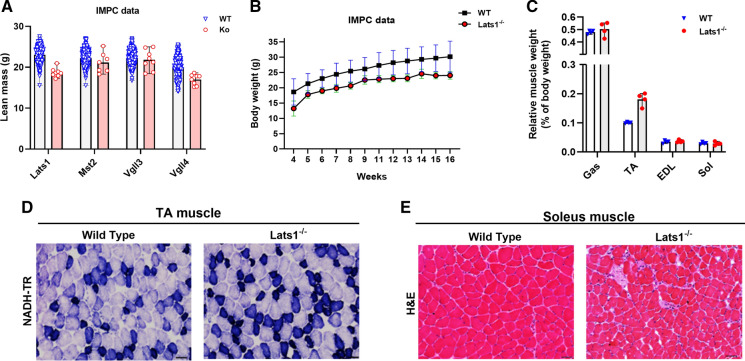
Fig. 1.
(a) Lean mass of Hippo gene-mutated (n = 6–8), and control (n = 499–1850) 16-week-old mice. (b) Average of total body weight of Lats1 knockout (n = 8) and its control (n = 3349) mice. (c) Relative muscle weights of Gastrocnemius (Gas), Tibialis Anterior (TA), Extensor Digitorum Longus (EDL), and Soleus (Sol) muscles normalized to total body weight of Lats1−/− mice versus wildtype control mice (n = 4). (d) NADH-Tetrazolium Reductase (NADH-TR) staining of tibialis anterior muscle cross-sections from control and Lats1−/− mice (high oxidative capacity is stained in dark blue, low oxidative capacity is stained in light blue; n = 4). (e) Hematoxylin and Eosin (H&E) staining of the soleus muscle cross-sections from control and Lats1−/− mice (n = 4). Scale Bar = 50 μm. All values are presened as mean ± SEM. *P < 0.05. KO: Knock Out; WT: Wild Type; g: gram; mg: milligram. See Figure S1 for further H&E and NADH staining

