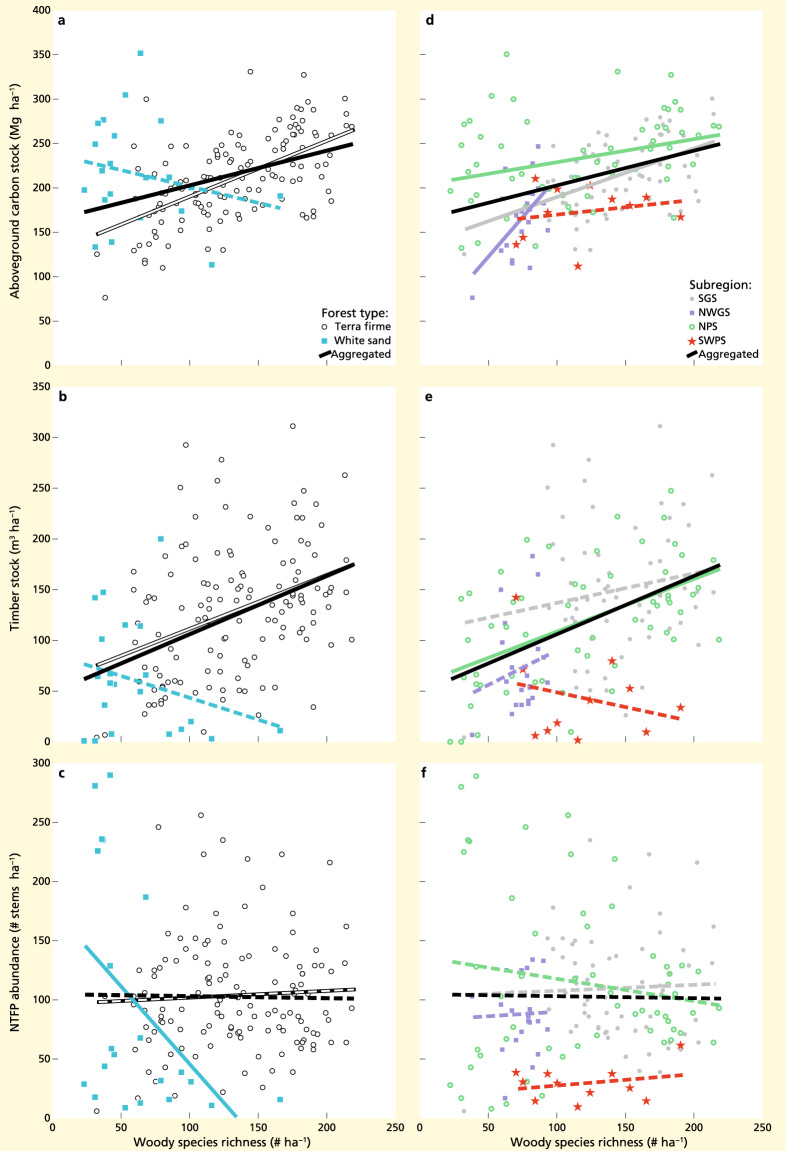
Figure 1.
Visualisation of linear bivariate relationships between species richness and carbon stock, timber stock, and non-timber forest products (‘NTFP’) abundance, across and within two forest types and four biogeographical subregions of the Guiana Shield. Showing relationships between species richness and carbon stock (panels a and d), between species richness and timber stock (panels b and e), and between species richness and NTFP abundance (panels c and f). Relationships across all forest types and subregions indicated by black lines (n = 151), within terra firme forests by white lines (n = 130), within white sand forests by blue lines (n = 21), within the Southern Guiana Shield by gray lines (n = 63; SGS), within the north-western Guiana Shield by purple lines (n = 21; NWGS), within the northern Pleistocene sands by green lines (n = 56; NPS), and within the south-western Pleistocene sands in the upper Rio Negro region by red lines (n = 11; SWPS). Solid lines indicate significant relationships (p < 0.05) and dashed lines non-significant relationships (p ≥ 0.05). Forest plots are coloured according to forest type or subregion. Model details are included in Tables S2.4 and S2.7.

