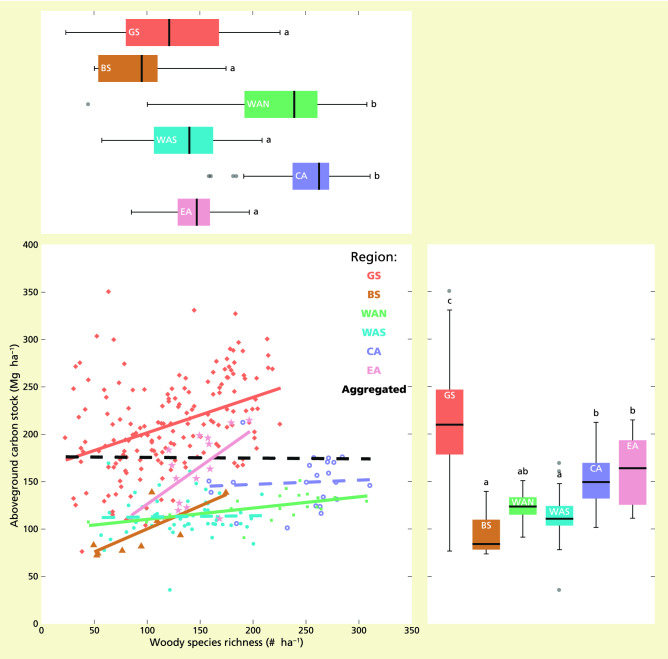
Figure 2.
Visualisation of linear bivariate relationships between carbon stock and species richness for different biogeographical regions in the Amazonia dataset. Relationships across all biogeographical regions (Agg., n = 283): black line; for Guiana Shield (GS, n = 165): red line, Brazilian Shield (BS, n = 9): dark yellow line, north-western Amazonia (WAN, n = 21): green line, south-western Amazonia (WAS, n = 51): light blue line, central Amazonia (CA, n = 22): purple line, and eastern Amazonia (EA, n = 15): pink line. Showing boxplots for carbon stock (bottom left) and species richness (upper panel) across the regions with differences according to Tukey post-hoc tests indicated by different letters. Model details are included in Tables S2.13–S2.15.

